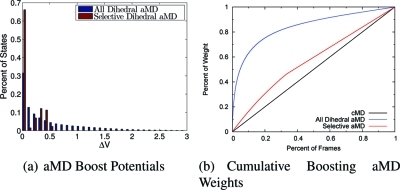
Figure 4.
(a) Distribution of boost potentials applied during the 50 ns simulations, showing an increased range of ΔV values throughout the all-dihedral aMD simulation relative to the selective dihedral aMD. (b) Percent of the total weight from the simulations relative to the percent of frames that contributed this weight. The lower ranges of boosts in the selective aMD produce more uniform sampling relative to the all-dihedral aMD, which tends to be dominated by a small subset of the configurations.

