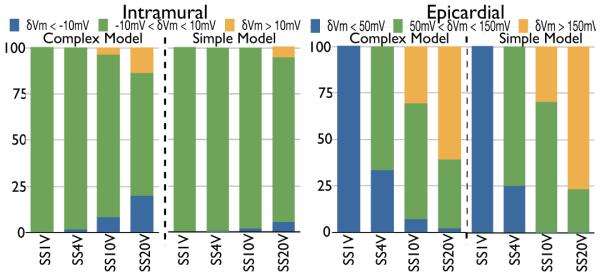
Fig. 7.
Histograms showing the percentage of nodes in the intramural region (left) with δVm levels < −10 mV (blue), between −10 and 10 mV (green), and > 10 mV (yellow); and, epicardial region (right) with δVm levels < 50 mV (blue), between 50 and 150 mV (green), and > 150 mV (yellow), for different SS for complex and simple models.

