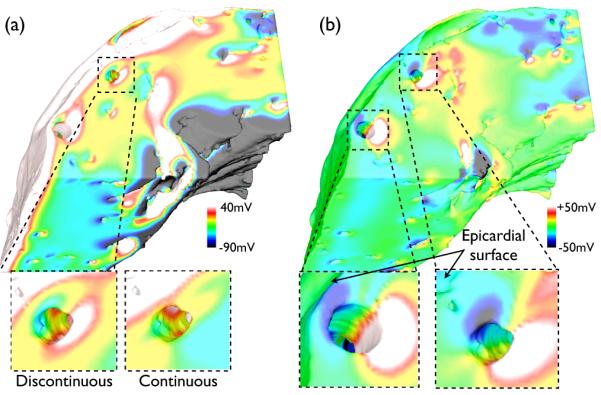
Fig. 9.

(a) Shock-end Vm distribution (SS 20 V) within complex model with discontinuous fibre architecture, with distribution near large blood vessel highlighted (bottom, left) and corresponding Vm distribution with continuous fibre architecture from Fig. 5 (SS 20 V, complex model) (bottom, right). (b) Difference map of Vm distribution of panel (a) minus that of Fig. 5 (SS 20 V, complex model), with selected regions near large vessels highlighted right.
