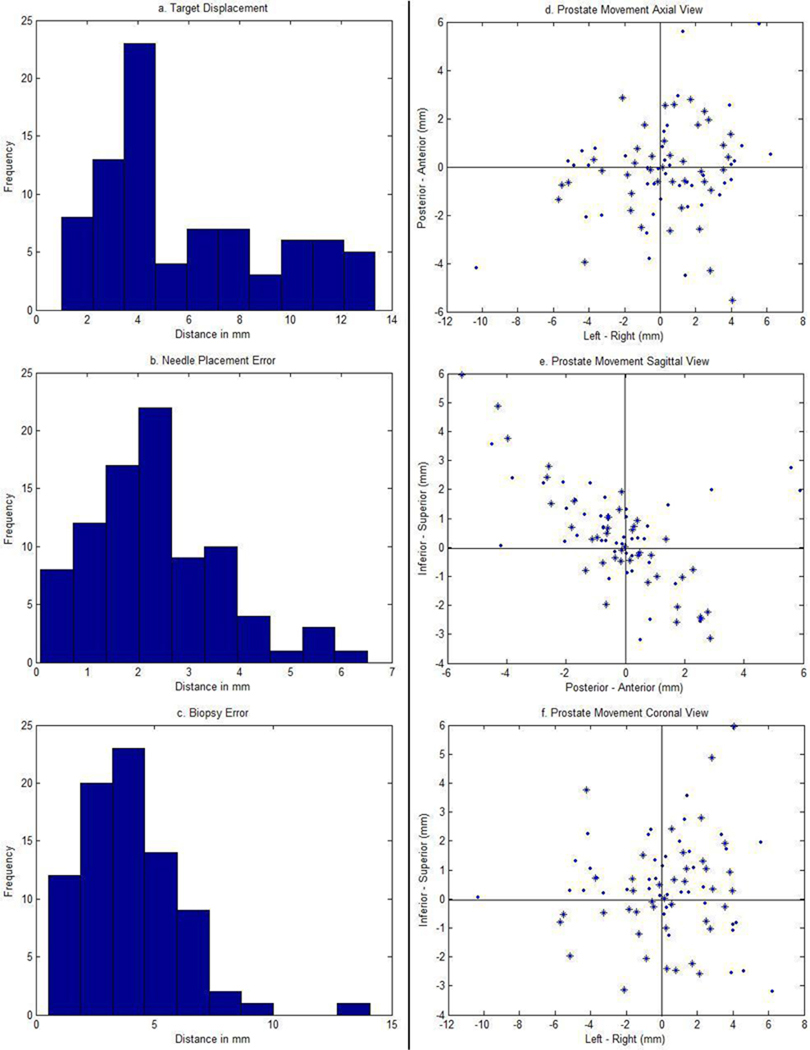
Fig. 4.
Left: Histograms of target displacements (top), needle placement errors (middle), and biopsy errors (bottom) of the 82 biopsies. Right: Axial (top), sagittal (middle), and coronal (bottom) view of prostate movement orthogonal to the needle direction. ‘*’ and ‘.’ indicate biopsies taken on the left and right side of the prostate, respectively.

