
Fig. 3. Laser scanning confocal immunofluorescence micrographs (rows A–G) and brightfield, two-color immunoreaction (panels H–J) demonstrate chemical heterogeneity of UBCs from various regions of the CN. Color channels are indicated in the individual panels.
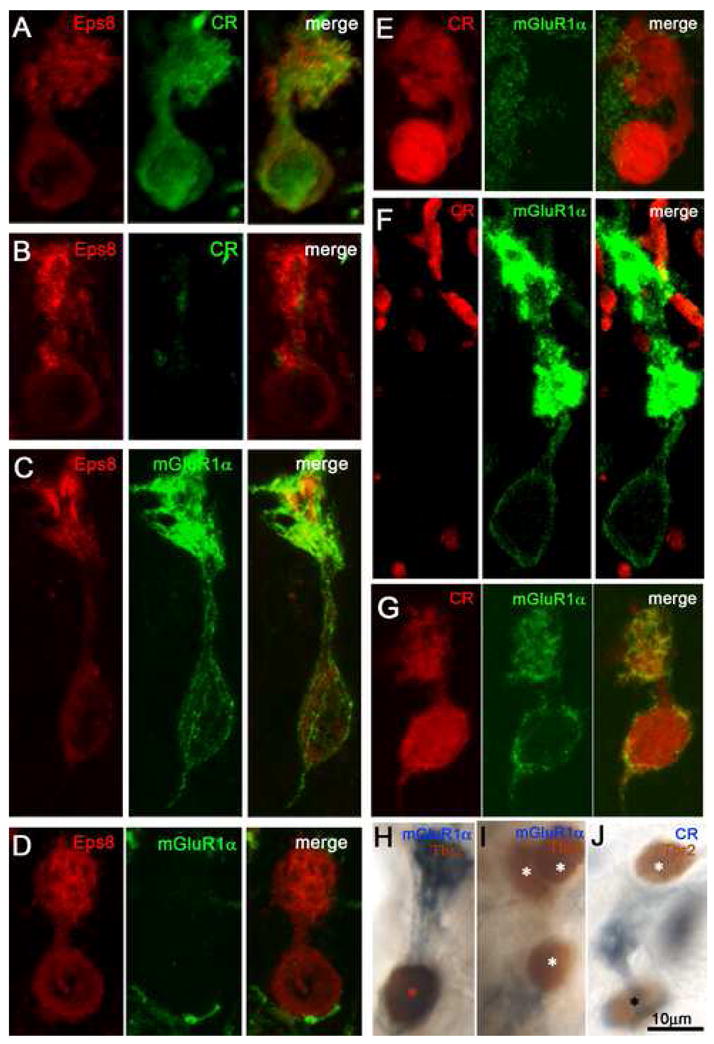
Row A: Eps8+/CR+ UBC from DCN. Row B: Eps8+/CR− UBC from DCN. Row C: Eps8+/mGluR1α+ UBC from spc. Row D: Eps8+/mGluR1α− UBC from DCN. Row E: CR+/mGluR1α− UBC from border of DCN and sgl. Row F: CR−/mGluR1α+ UBC from PVCN. Row G: UBC immunopositive for both CR and mGluR1α, from anr. Panel H: Tbr2+/mGluR1α+ UBC from tz. Panel I: Cluster of three Tbr2+/mGluR1α− UBCs from the DCN. Panel J: Two UBCs, one of which is Tbr2+/CR+ and the other Tbr2+/CR− from sp5. Asterisks in panels H–J indicate Tbr2-immunoreactive UBC nuclei. Magnification bars = 10 μm.