
Figure 4.
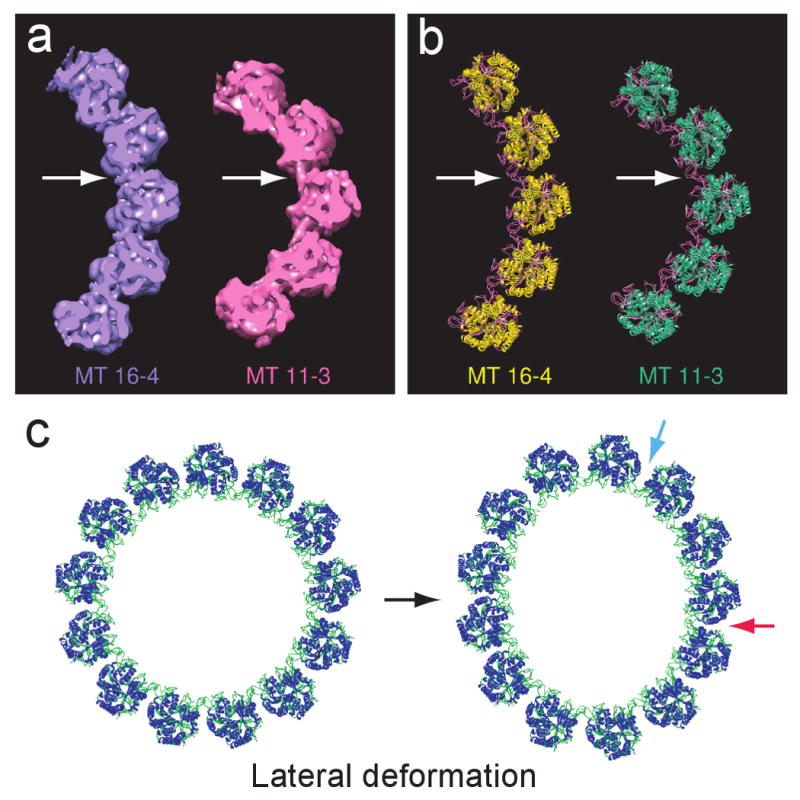
End-on views of the MT density maps and the structural model of MT lateral deformation (see also Movie S1). Panels (a) and (b) show significant difference in lateral curvature for the extreme pairs of our structural maps and models, MT 16-4 and MT 11-3. Arrows point to lateral connection region in (a) the density maps and (b) the structural models; here, loops belonging to adjacent tubulin molecules in the neighboring PFs appear to mediate the inter-PF interaction. (c) Model for 8% deformation of the 13-3 MT, a degree of deformation that has been found experimentally in the A-tubule of MT doublets. The red arrow indicates a closely packed region in which lateral curvature is decreased; the blue arrow indicates a loosely packed region with a high lateral curvature.