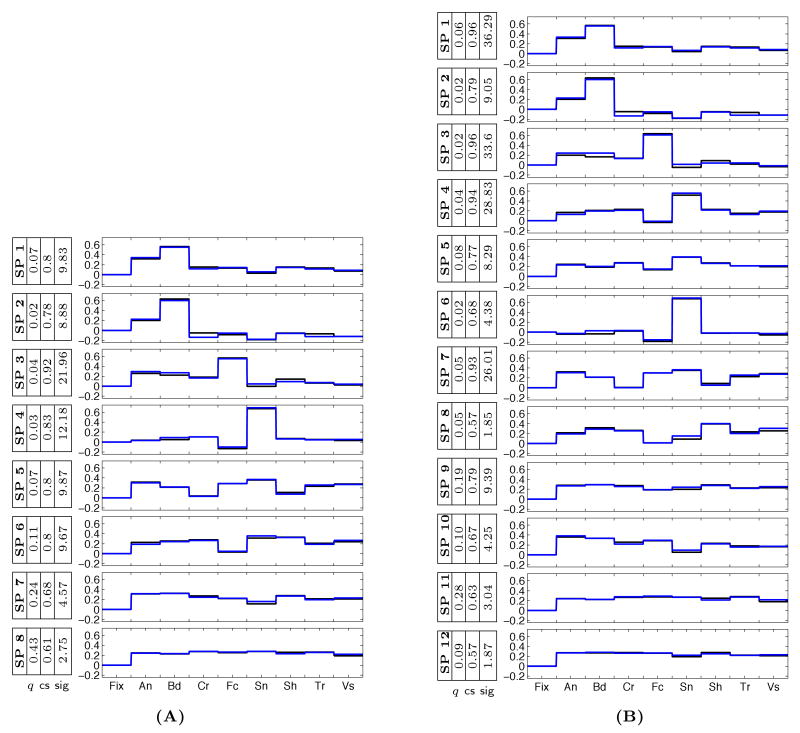
Fig. 5.
Group system selectivity profiles in the 16-Dimensional data for (A) 8, and (B) 12 clusters. The colors (blue, black) represent the two distinct components of the profiles corresponding to the same category, and the weight q for each system is also indicated along with the consistency score (cs) and its significance value found in the permutation test.

