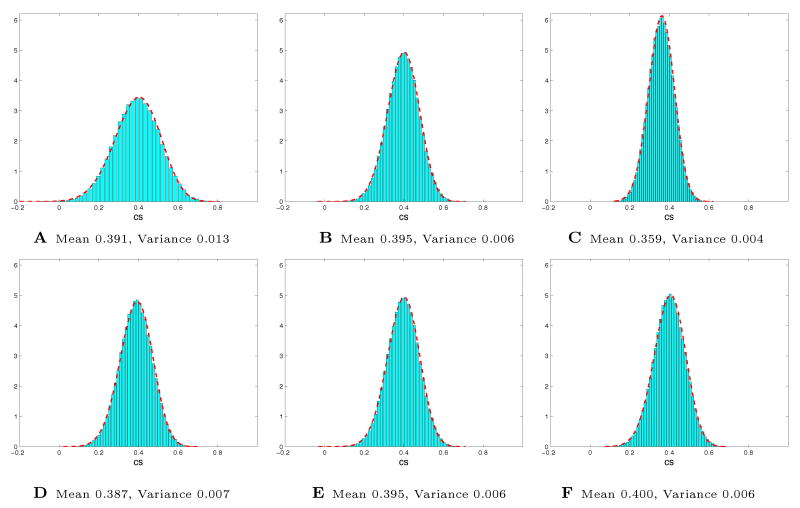
Fig. 6.
Null hypothesis distributions for the consistency score values, computed from 10,000 random permutations of the data. Histograms A, B and C show the results for 8, 16, and 32-Dimensional data with 10 clusters, respectively. Histograms D, E, and F correspond to 8, 10, and 12 clusters in 16-Dimensional data (B and E are identical). We normalized the counts by the product of bin size and the overall number of samples so that they could be compared with the estimated Beta distribution, indicated by the dashed red line.

