
Fig. 7.
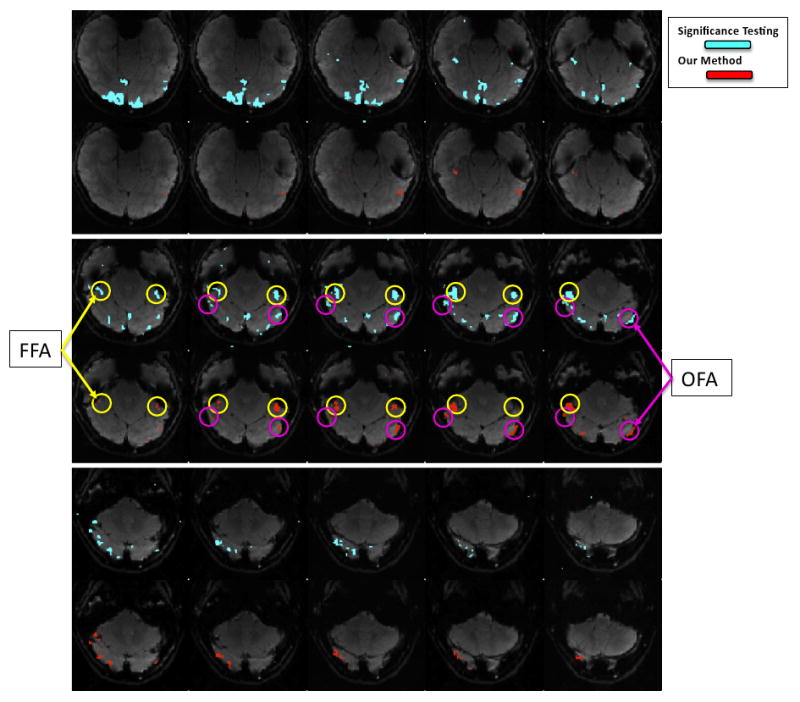
Spatial maps of the face selective regions found by the significance test (light blue) and the mixture model (red). Slices from the each map are presented in alternating rows for comparison. The approximate locations of the two face-selective regions FFA and OFA are shown with yellow and purple circles, respectively.