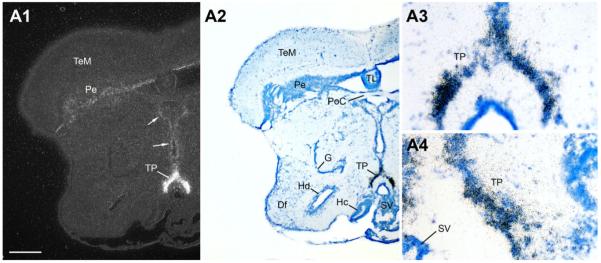
Figure 9.
A1–A4: The posterior tuberal nucleus (TP), shown in high magnification at two levels, has perhaps the highest abundance of AR mRNA in the central nervous system. Also note consistent signal (arrows) along the ventricular midline in the thalamus (midline) and in the periventricular cell layer of the tectum (Pe). Scale bar = 500 μm for panels A1–A2; 100 μm for A3–A4. [Color figure can be viewed in the online issue, which is available at www.interscience.wiley.com.]

