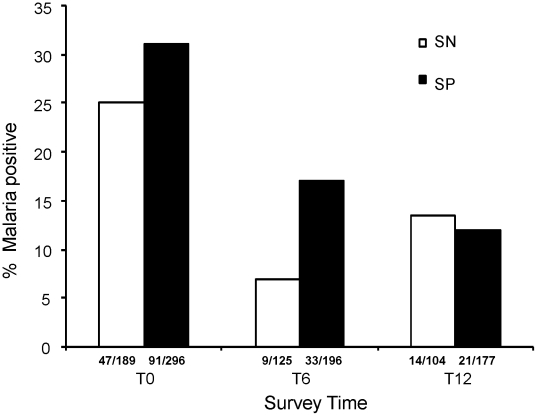
Figure 3. Effect of schistosome infection on malaria prevalence.
Total number of children testing positive for malaria at T0, T6 and T12 among schistosome positive (SP) and negative (SN) are shown on x-axis. The bars show the percentage values for each survey time point. A higher proportion of schistosome positive children (black bars) had malaria parasites at T0 (p = 0.064) and T6 (p = 0.053) compared to the schistosome negative children (white bars). At T12 the malaria prevalence was not different for the two groups.

