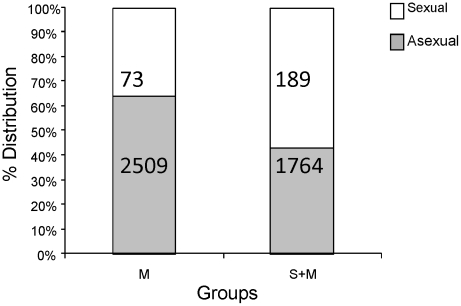
Figure 4. Percentage distributions and geometric mean parasite densities of sexual (gametocyte) and asexual (ring) parasites in malaria-infected children.
Numbers inside bars represent geometric mean parasite density values for sexual (white bars) and asexual (black bars) in the M (n=14) and S+M (n=28) groups for a subset of subjects for which these data were available. Co-infected children had a higher proportion of gametocyte infection (p=0.06) and higher mean gametocyte density in blood (p=0.043) compared to malaria only infected children (M).

