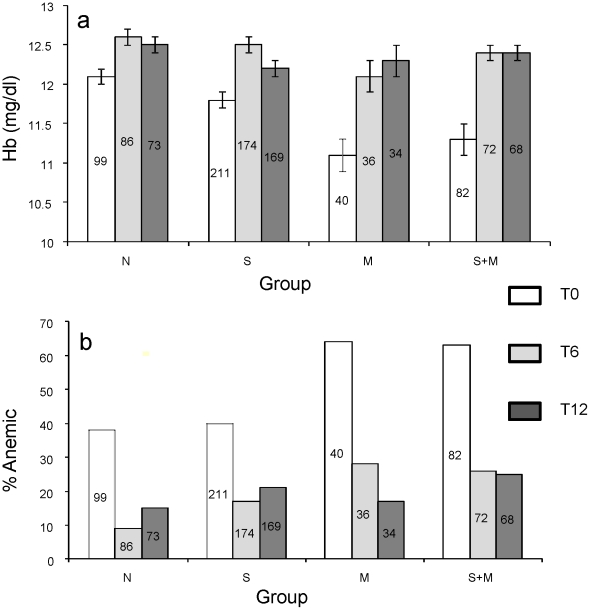
Figure 5. Mean hemoglobin levels and prevalence of anemic children for each diagnostic group at different sampling times.
At T0, differences in the hemoglobin levels (Figure 5a) in groups M and S+M were statistically significant (p<0.001 by t-test) as compared to group N. A comparison between M and S+M and groups N and S revealed non-significant p values, 0.743 and 0.183, respectively. Figure 5b shows results of proportion of anemic children in various groups, p values at T0 for differences between groups N and M, groups N and S+M and groups N and S were 0.01, 0.001, and 0.273, respectively. The numbers in each bar represent ‘N’ for each group and the error bars represent SEM.

