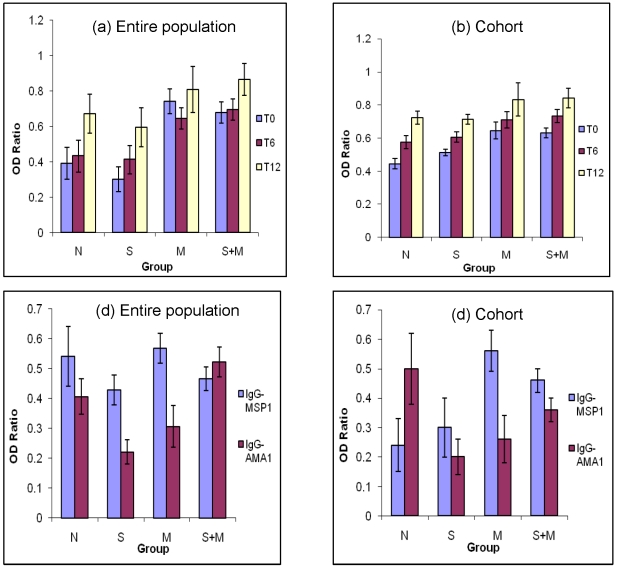
Figure 6. Comparisons of mean OD ratio of IgG to crude and specific P. falciparum antigens at different time points.
The antibody levels were determined by ELISA from serum samples from children in various diagnostic groups. Generally antibody activity increased with time from T0 to T12 with higher activity in children who had malaria at baseline. Total number of serum samples for data on entire population in Figure 6a were T0 (n = 446), T6 (n = 342), and T12 (n = 310). Figure 6b shows data on 82 children in the cohort at all three time points (T0, T6, T12). Figure 6c shows antibody reactivity results of population sera to MSP-1 (n = 193) and AMA-1 (n = 198) at T0. Figure 6d shows results for cohort children to MSP-1 (n = 79) and AMA-1 (n = 81) at survey T0. Comparison of OD ratios between groups M and S+M or groups N and M for AMA-1 revealed p values of 0.006 and 0.001, respectively by Mann-Whitney test. Error bars represent SEM.

