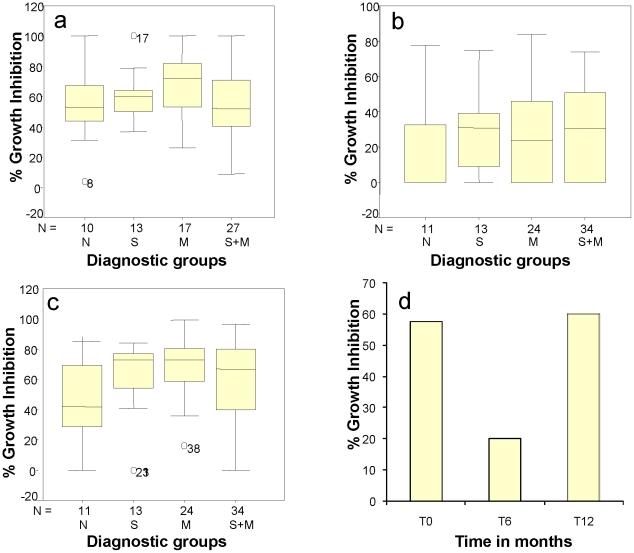
Figure 8. Mean growth inhibition activity of different groups at different malaria seasons and survey times.
Ability of subjects' plasma samples to inhibit P. falciparum growth from each group at T0 (Fig. 8a), T6 (Fig. 8b) and T12 (Fig. 8c) are shown. The box plots display in vitro percentage growth inhibition activities of P. falciparum by participants' plasma samples (at 10% concentration) after 48 h growth of synchronized W2 culture. The middle horizontal line in each box indicates the median percentage growth inhibition for each diagnostic group, and the box indicates the 25th and 75th percentiles. The whisker caps extending from each box indicate the minimum and maximum values. Individual marked points represent a few outlier values. Figure 8d represents mean growth inhibition data for the entire cohort at three transmission seasons (T0, T6, T12).

