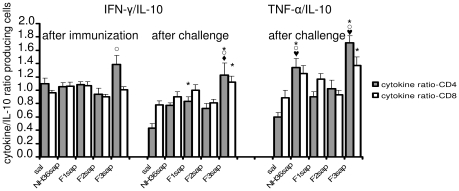
Figure 5. Development of NH36-specific cellular immune response as disclosed by intracellular staining analysis of splenocytes in vitro cultured with NH36 before and after L. chagasi infection.
Anti-CD4-FITC and anti-CD8-FITC antibodies were used for labeling the cell surfaces and anti-IFN-γ-APC, anti-TNF-α-PE and anti-IL-10-PE for intracellular staining. In order characterize the TH1 response bars represent the ratio of IFN-γ/IL-10 and TNF-α/IL-10 producing cells. Results represent mean + SE of two independent experiments (n = 7–8 mice per treatment). * p<0.05 indicate significant differences from the saline treated controls,  from F1sap, ○ from F2sap, and ◆ from the NH36sap vaccine.

