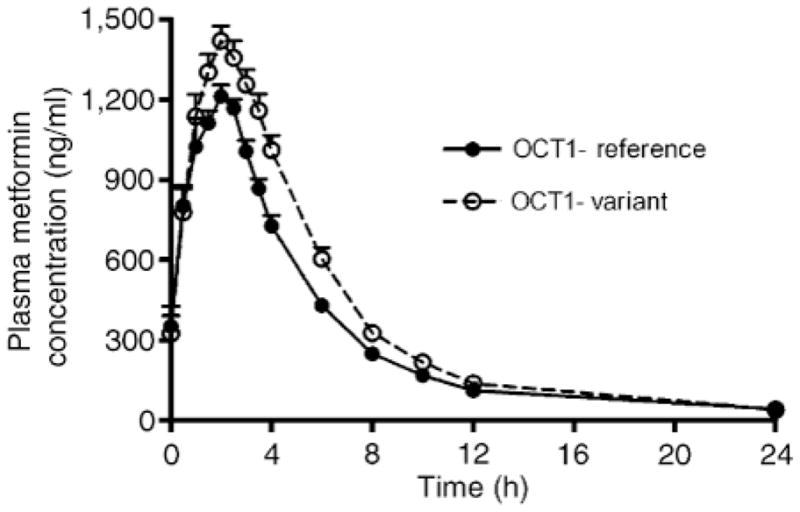
Figure 1.

The plasma concentration-time curves of metformin after oral administration in healthy individuals who carry an OCT1-variant allele (n=12) and those who carry only OCT1-reference alleles (n=8). The individuals were given two doses of metformin. The first dose of 850mg was given at 1800hours on study day 1 and the second dose of 1,000mg at 0600hours on study day 2. Blood samples for the pharmacokinetic analysis were drawn up to 24h after the second dose. The plasma metformin concentration-time curves after the second dose are shown. Data represent mean±SE.
