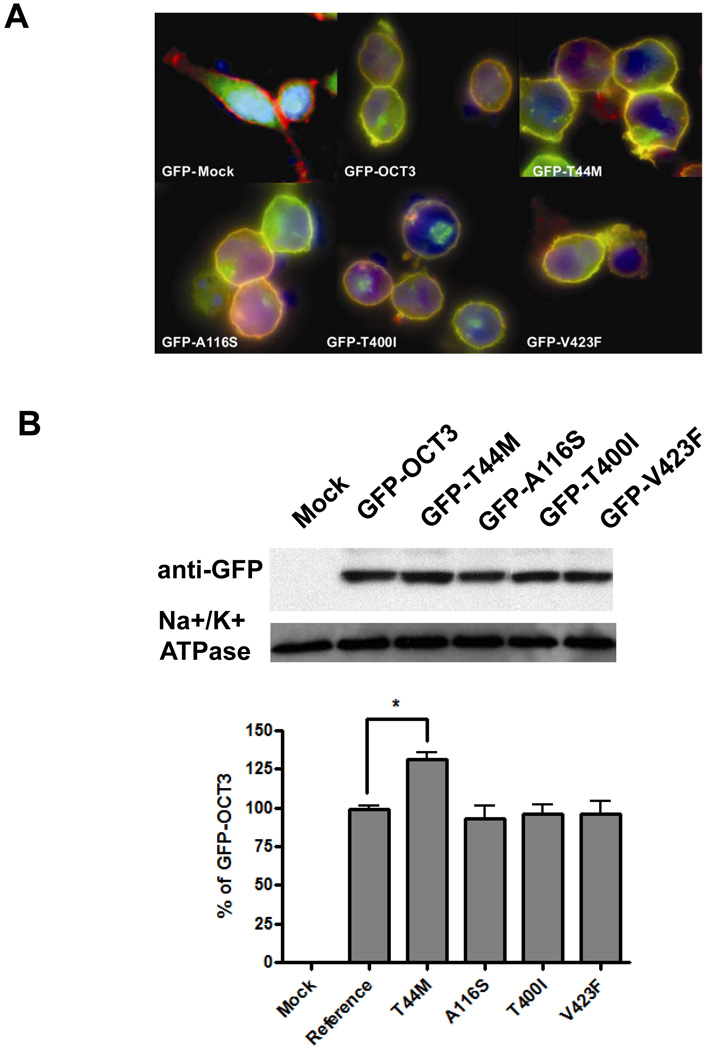
Figure 5. Subcellular localization and expression quantification of GFP-tagged various OCT3.
A. Subcellular localization of GFP tagged OCT3 reference and 4 nonsynonymous variants (GFP-T44M, GFP-A116S, GFP-T400I and GFP-V423F). Various OCT3 GFP fusion constructs were stably expressed in HEK-293 cells and visualized by fluorescent microscopy. The nucleus is stained with DAPI (blue). The plasma membrane was stained using AlexaFluor 594-labeled wheat germ agglutinin (red) for co-localization staining. GFP-OCT3 protein is shown in green. B. Western blotting assay of GFP-Mock, GFP-tagged OCT3-reference and 4 variants above. Mouse monoclonal anti- Na+/K+ ATPase served as loading control. The GFP-OCT3 position is around 100 kD shifted from the 60 kD position of OCT3 itself. The bar chart represents the intensity of each band normalized to the Na+/K+ ATPase band relative to the GFP-OCT3-reference based on 3 independent assays.

