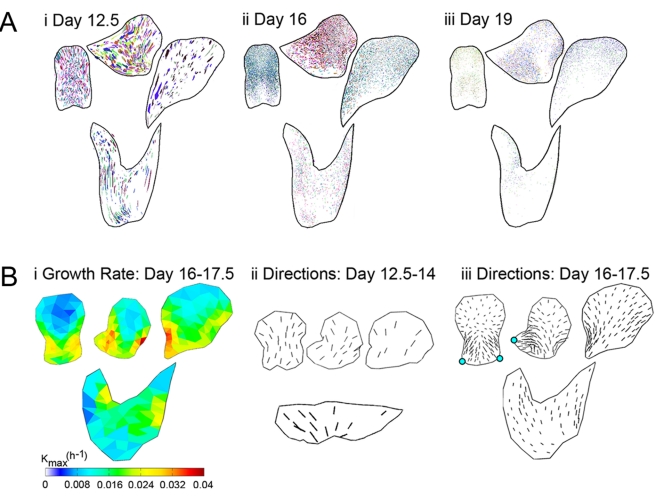
Figure 3. Clonal analysis of wild-type corolla.
(A) Clones on dissected, flattened petals from 6 flowers induced at day 12.5 (i), day 16 (ii), and day 19 (iii), warped to a mean shape for each petal section (D, L, V, T—see Figure 1C) and overlaid, using a different colour for each flower. (B) Regional growth parameters based on clonal analysis (using grids in Figure S12). (i) Maximal growth rates, Kmax, for the period day 16–17.5. Rates are highest (red/yellow) along the lobe edges. (ii) Principal orientations of growth for the period day 12.5–14, shown as short lines scaled according to the value of Kmax. (iii) Principal orientations of growth for the day 16–17.5 interval. Cyan spots indicate foci at the ventral lobe junctions (numbered 2 in Figure 1C).

