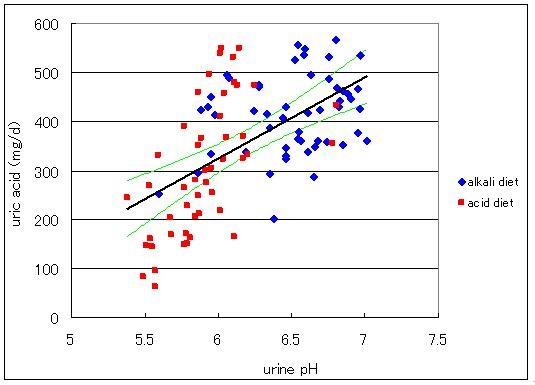
Figure 3.

Relationship between excreted uric acid as expressed in mg uric acid in urine per day and urine pH. Diamonds indicate data for the alkali diet and squares those for the acid diet. Equation for the straight line obtained by the least square method is y = 165x-669(R2 = 0.342, n = 102, p < 0.01). The lines above and below the regression line are the 99% confidence limits.
