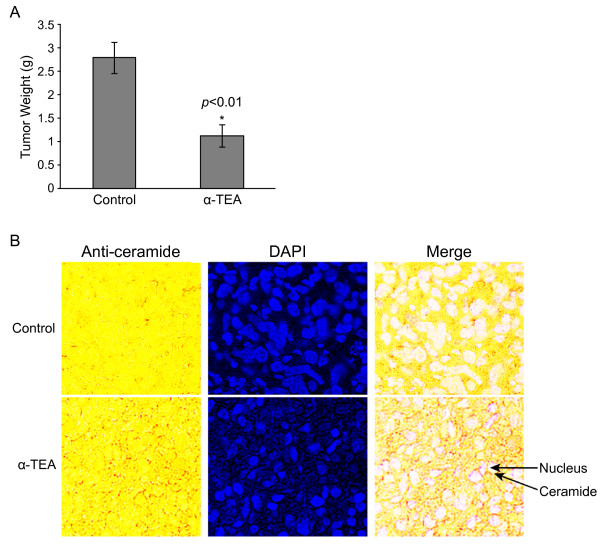
Figure 8.
α-TEA induced membrane ceramide accumulation in tumor tissue in vivo. A, Mean tumor weight ± S.D. for α-TEA treatment and control groups at euthanasia (N = 10). B, Tumor tissue sections (5 microns) from α-TEA treated and control were stained for ceramide by immunohistochemistry (brown) and with the DNA-fluorescent label DAPI (blue), and the two images were merged. Note: After merging the anti-ceramide stained tissue obtained from regular light with the blue nuclear staining obtained from UV light, the nuclear color turns to white in the merge image. Images are representative of three samples each of treatment and control group.

