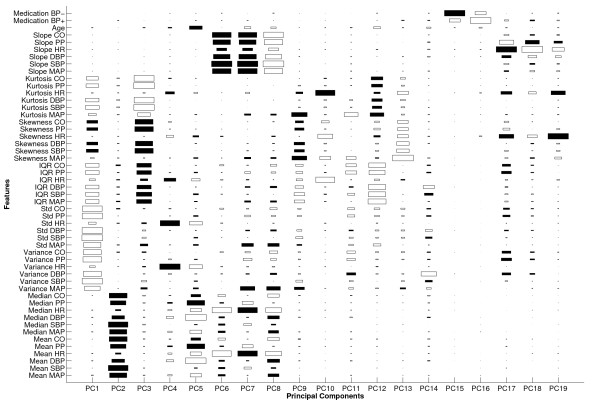
Figure 4.
A visual illustration of PCA loading on the first 19 principal components that captured 90% of the total variance in the entire multiple compilation data. Only the statistical and clinical features are shown; see Figure 5 for the cross-correlation and wavelet features. The principal components are sorted in decreasing order of eigenvalue, with PC1 associated with the largest eigenvalue. The gap and observation window were 1 hour and 30 minutes long, respectively. The size of each rectangle is directly proportional to the magnitude of the loading. Filled and unfilled rectangles correspond to positive and negative loading coefficients, respectively.

