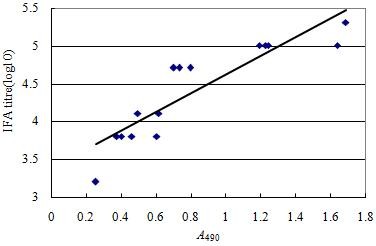
Figure 6.

Scatter plots of log10 IFA titers of 16 serum samples against OD ratios of the corresponding serum obtained from GST-ORF2-E ELISA.

Scatter plots of log10 IFA titers of 16 serum samples against OD ratios of the corresponding serum obtained from GST-ORF2-E ELISA.