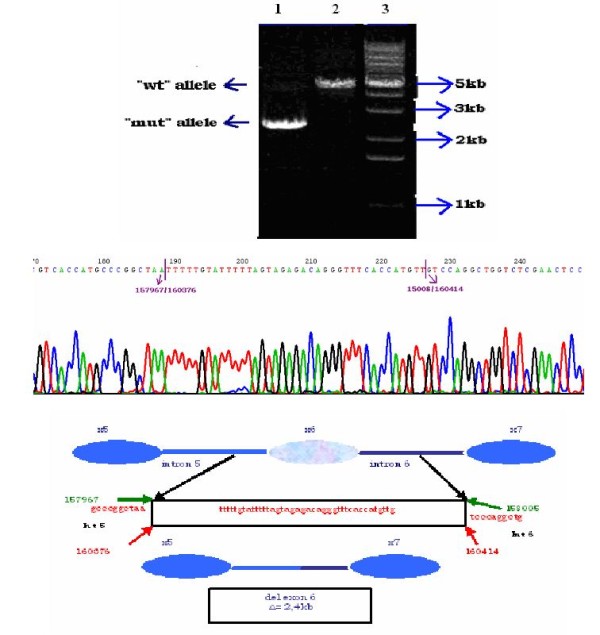
Figure 3.

Breakpoint analysis of the MLH1, c.454-?_545+?del. The products after long range PCR are shown in the upper part of the figure. In the first two lanes corresponding to DNA samples of the 263CRC family members we obtained a discernible band of ~2.5 kb, as well as a fainted band with the expected size of ~5 kb while in the third lane with control DNA sample we got only the band of ~5 kb which corresponds to the expected "wt" allele. Lane 4: 100 bp ladder, lane 5: negative control, lane 6: 1 kB ladder. The PCR product obtained by the combination of F3 and R1 primers was sequenced with R1 and revealed the deletion breakpoints, which are indicated by purple arrows upon the chromatogram. The size and the boundaries of the deletion are depicted schematically in the lower part of the figure.
