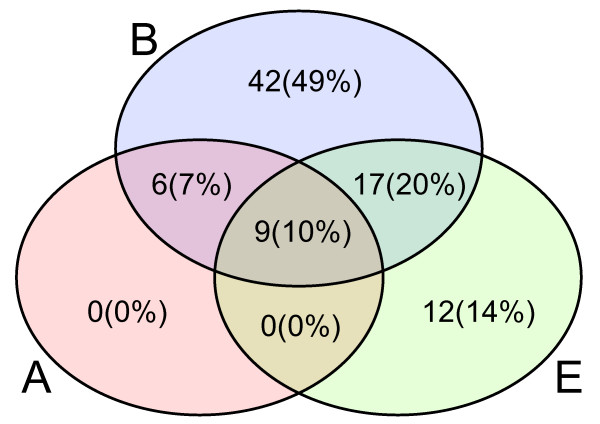
Figure 3.
Venn diagram of kingdom representation in MDR families. This diagram illustrates the presence of sequences from the different kingdoms in the MDR families with number (and proportion). Each circle encapsulates those families that have at least one sequence from that corresponding kingdom. Blue (top) denotes bacteria, red (left) denotes archaea, and green (right) denotes eukarya. Intersections encapsulate families having at least one member sequence from the corresponding kingdoms.

