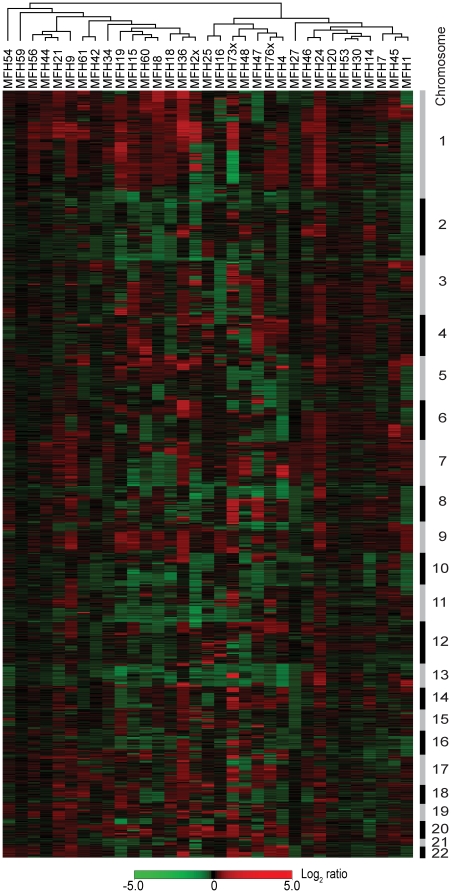
Figure 1. Hierarchical clustering of MFHs.
Hierarchical clustering of 33 MFHs using DNA copy number ratios relative to a pool of normal diploid DNA. A total of 3,144 unique genomic clones are shown in chromosomal order from 1ptel to 22qtel. Chromosomes are indicated with black and grey bars. Red, increases in DNA copy number; green, decreases in DNA copy number.

