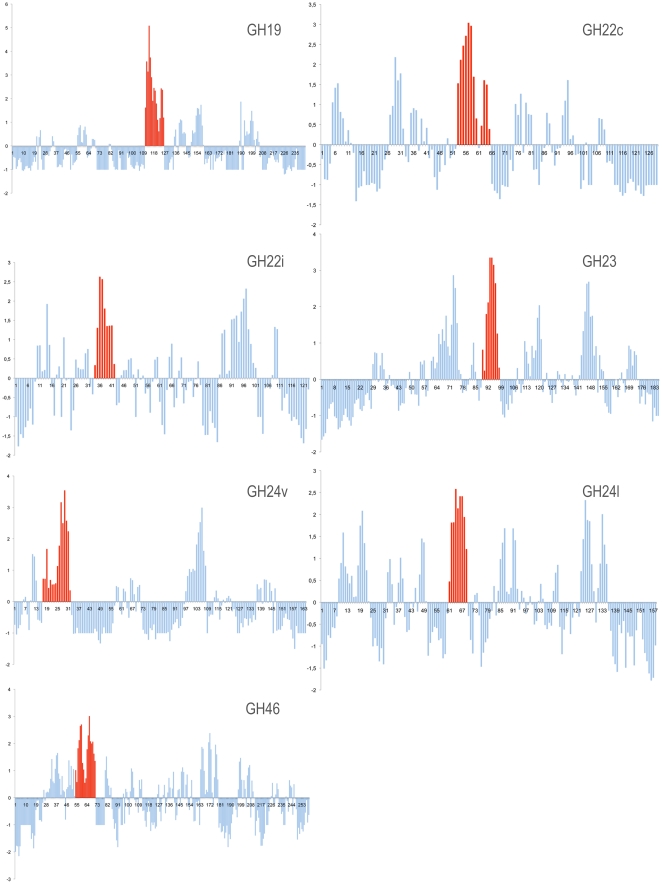
Figure 3. Amino acid conservation profiles in aligned sequences of GH families.
AL2CO conservation indices [41] at each position in multiple sequence alignment for each GH families are mapped on the sequence of the corresponding representative protein. The regions displaying the highest conservation indices are showed in red.

