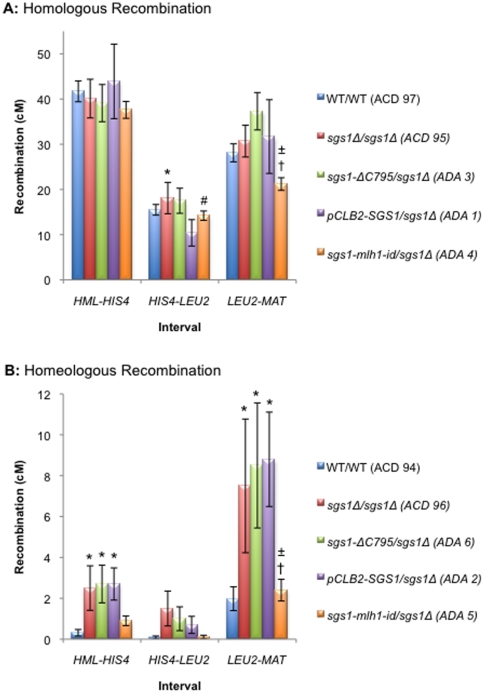
Figure 3. Map distances on chromosome III.
(A) Homologous recombination. B) Homeologous recombination. Map distances were calculated using the Perkins formula [85]. The distribution of PDs, NPDs and TTs for homologous diploids was compared using the G-test. After correcting for multiple comparisons using the Benjamini-Hochberg correction [86], p-values <0.05 were considered significant. The standard error of the map distances was calculated using Stahl Online Tools (http://molbio.uoregon.edu/~fstahl/compare2.php). * - significantly different from WT/WT; # - significantly different from sgs1Δ/sgs1Δ; † - significantly different from sgs1-ΔC795/sgs1Δ; ± - significantly different from pCLB2-SGS1/sgs1Δ.

