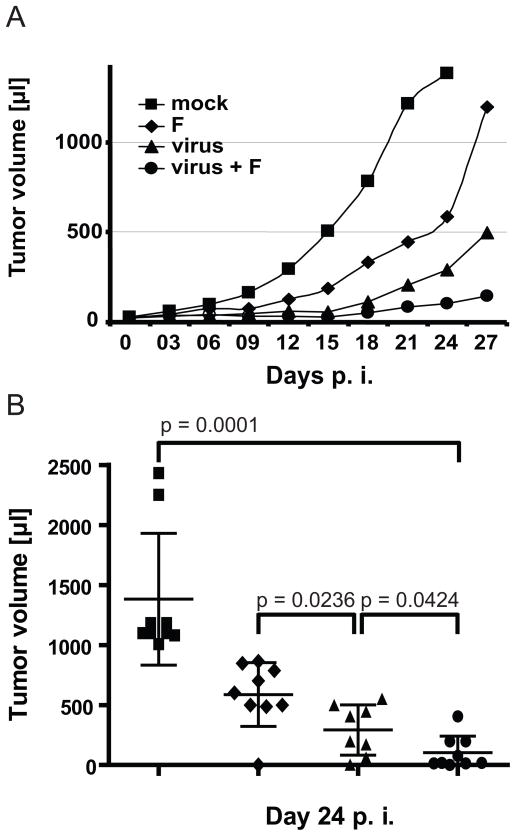
Figure 2.
Systemic treatment with virus and fludarabine reduces tumor burden. (A) Time course of tumor growth in four groups of 8–9 mice treated as indicated in the text. Curves are shown until the time when two mice in a group had to be sacrificed. (B) Tumor volumes of individual mice 24 days after the beginning of the treatment. The average tumor volume is indicated by an horizontal line; error bars indicate the standard deviation.

