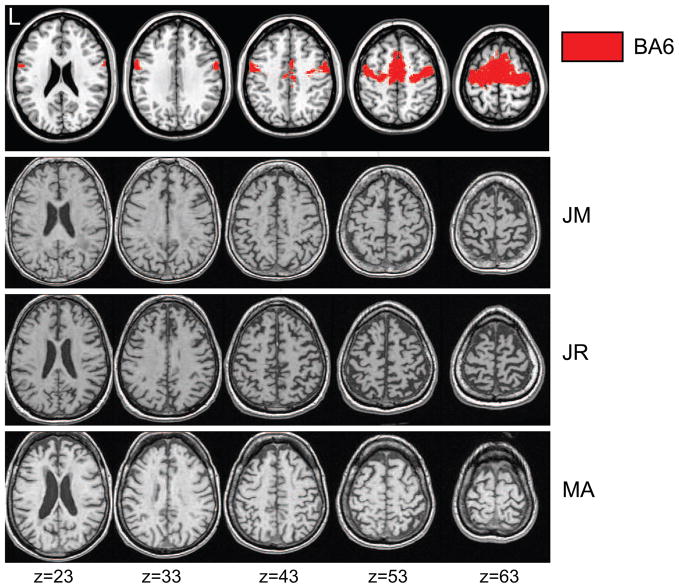
Figure 1. Multi-slice T1 Structural MR Images of Varying Severity PNFA.
Top row: Template brain showing in red regions of premotor cortex (BA6) defined by a probabilistic cytoarchitectonic atlas. Below: Slices from normalized structural MRIs of three individual PNFA patients. MNI coordinates of the axial slice are shown below the figure in mm.

