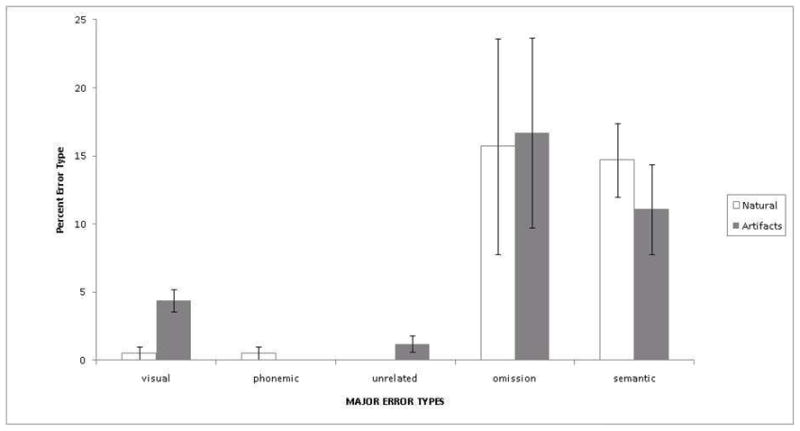
Figure 3. Distribution of Major Error Types for Artifacts and Natural Kinds.

Note: The graph above shows the percentage of errors for natural kinds (white) and artifacts (gray) relative to the set size. For example, we calculated the “semantic error percentage for artifacts” by dividing the mean number of artifact semantic errors (4.22 per patient) by the total number of artifact target names (n=38) and multiplying by 100. Error bars reflect the Standard Error of the Mean (SEM).
