Figure 2.

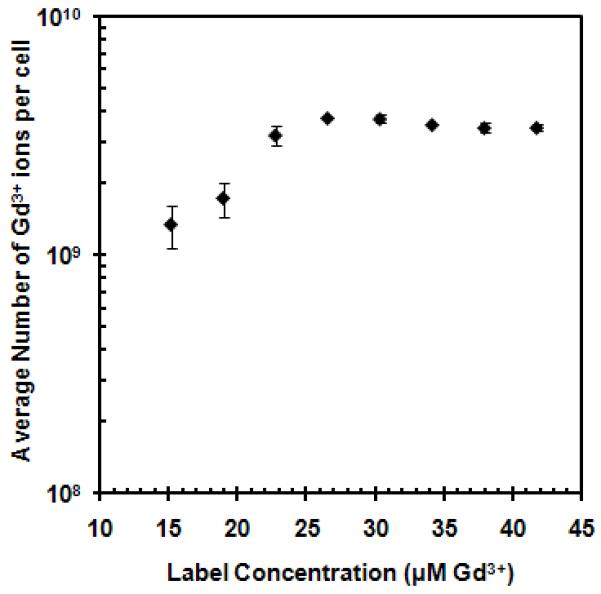
MSC uptake of GNTs as a function of GNT concentration. The graph is plotted on a logarithmic scale with error bars being standard deviations Note: error bars may be smaller than the symbols.

MSC uptake of GNTs as a function of GNT concentration. The graph is plotted on a logarithmic scale with error bars being standard deviations Note: error bars may be smaller than the symbols.