
Figure 4.
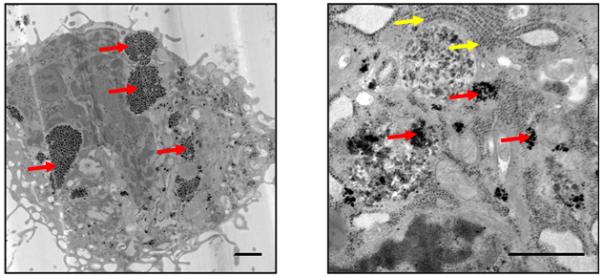
TEM images of a GNT-labeled MSC. Red arrows point to GNT aggregates in the cytoplasm. Yellow arrows point to ribosomes of the endoplasmic reticulum. Scale bar = 1 μm.
Official websites use .gov
A
.gov website belongs to an official
government organization in the United States.
Secure .gov websites use HTTPS
A lock (
) or https:// means you've safely
connected to the .gov website. Share sensitive
information only on official, secure websites.
TEM images of a GNT-labeled MSC. Red arrows point to GNT aggregates in the cytoplasm. Yellow arrows point to ribosomes of the endoplasmic reticulum. Scale bar = 1 μm.