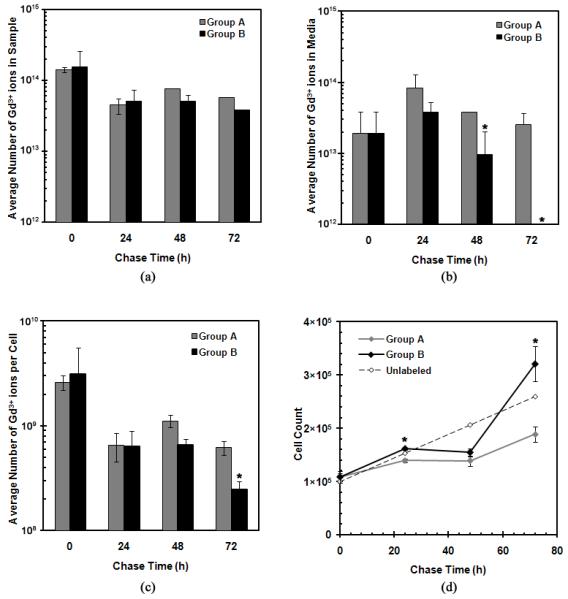
Figure 5.

GNT retention in MSCs as a function of chase time: (a) the total average number of Gd3+ ions found in the cell samples, (b) the total average number of Gd3+ ions in the media, (c) the total average number of Gd3+ ions per GNT-labeled cell, and (d) the cell count of each cell sample upon collection. All graphs are plotted on a logarithmic scale with error bars being standard deviations. Note: error bars may be smaller than the symbols; * represents statistical difference (P < 0.05).
