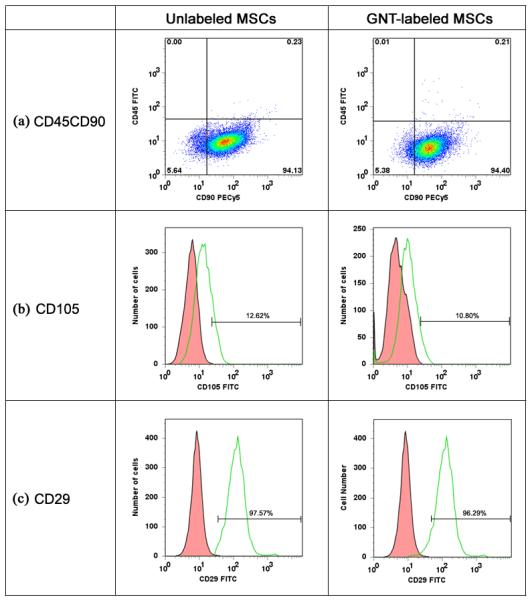
Figure 7.

Flow cytometry analysis performed on both unlabeled and GNT-labeled MSCs to determine the expression of CD45, CD90, CD105, and CD29. Histograms represent (a) cells incubated with FITC-labeled mouse anti-pig CD45 and PECy5-labeled mouse anti-human CD90, (b) cells incubated with the FITC-labeled CD105, and (c) cells incubated with FITC-labeled mouse anti-pig CD29. Isotype control, red; MSC samples, green.
