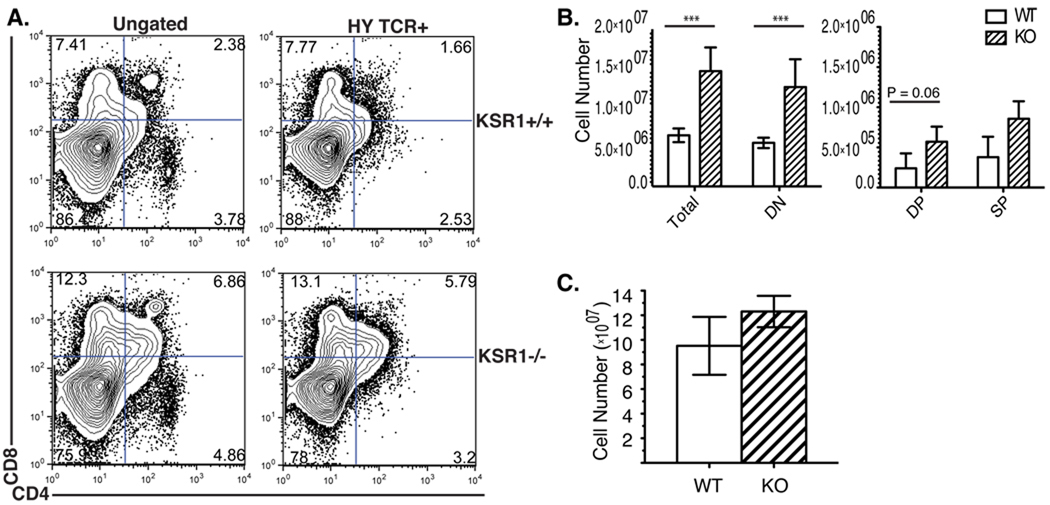
Figure 3. Negative selection in KSR1−/− male HY mice is slightly impaired.
Single cell suspensions of (A, B) thymi and (C) spleen from HY male wild-type or KSR1−/− mice were counted using trypan blue exclusion and stained with antibodies to CD4, CD8, CD3 and HY TCR. Cells were collected on a BD FACSCalibur and analyzed using Flowjo software. Representative FACS plots are shown either ungated (left) or gated on HY TCR+ cells (right) in (A). Cell numbers are representative of 4 mice per group and are shown as mean ± SD (B, C). Unless otherwise specified, differences between groups are not significant (P > 0.05). ***P<0.001, unpaired Student’s t-test.

