Figure 3.
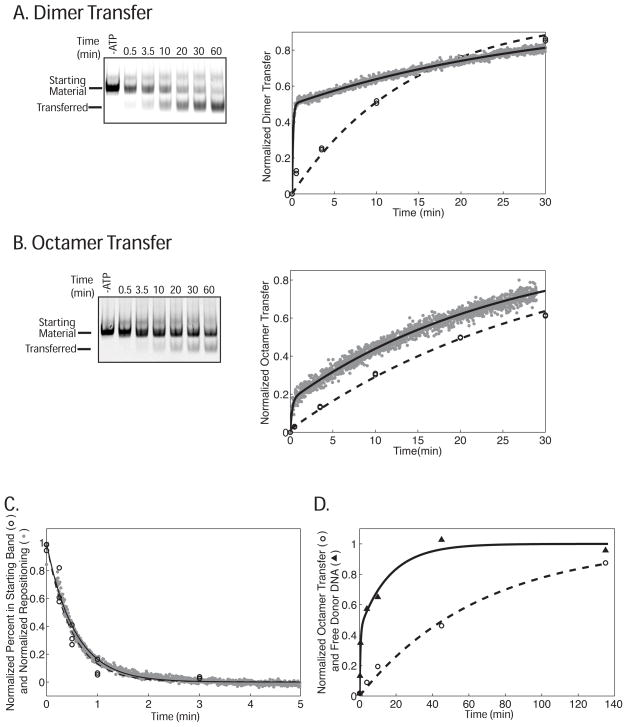
Changes in FRET precede the formation of transfer products as visualized by gel for both (A) dimer transfer and (B) octamer transfer but not (C) repositioning. In (A) and (B) reactions containing the nucleosome constructs shown in Figure 2 were run on a native gel. The left panels show a representative gel scanned in the Cy5 channel. The graphs on the right show the corresponding normalized data from two separate native gel experiments (open circles with the fit shown as a dashed line) and one representative FRET-based assay (gray data points with the fit shown as a black line). The rate constant for dimer exchange and octamer transfer as measured in the gel assay were 0.072 ± 0.00012 min−1 and 0.034 ± 0.00042 min−1 respectively. These rate constants are the average and variation of two separate experiments. The rate constants for dimer and octamer transfer as measure by FRET are reported in Table 1 and are the average of three independent experiments including the ones shown in (A) and (B). Reactions (A) and (B) were preformed using 1 mM ATP. (C) The rate constant for repositioning was measured by both the FRET-based and native gel-based assays using the 0-601-55 nucleosomes used in Figure 2. To enable accurate measurement of the repositioning rate constants, the ATP concentration was lowered to 4 μM. The graph shows the corresponding normalized data from the native gel (open circles with the fit shown as a dashed line) and FRET assays (gray data points with the fit shown as a black line). The rate constants measured by FRET and native gel were 1.8 ± 0.074 min−1 and 2.1 ± 0.29 min−1 respectively. These rate constants are the average and standard error of the mean of three separate experiments. (D) Donor DNA is released more quickly than the octamer transfer product appears on the gel. Octamer transfer experiments were performed using 20-601-45 nucleosomes as an octamer donor and a 147 bp 601 containing DNA fragment as the acceptor at 1 mM ATP. The graph shows representative curves for normalized octamer transfer (open circle with a one phase fit shown as a dashed line) and normalized free donor DNA (black triangles with a two phase fit shown as a black line). The rate constant for octamer transfer was 0.037 ± 0.019 min−1. The data for acceptor DNA release fit best to two phases. However, the fast phase is too fast to accurately measure given the number of data points but we estimate a lower limit to be 3 min−1. The rate constant for the slow phase is 0.045 ± 0.011 min−1. These rate constants are the average and standard error of the mean of three separate experiments.

