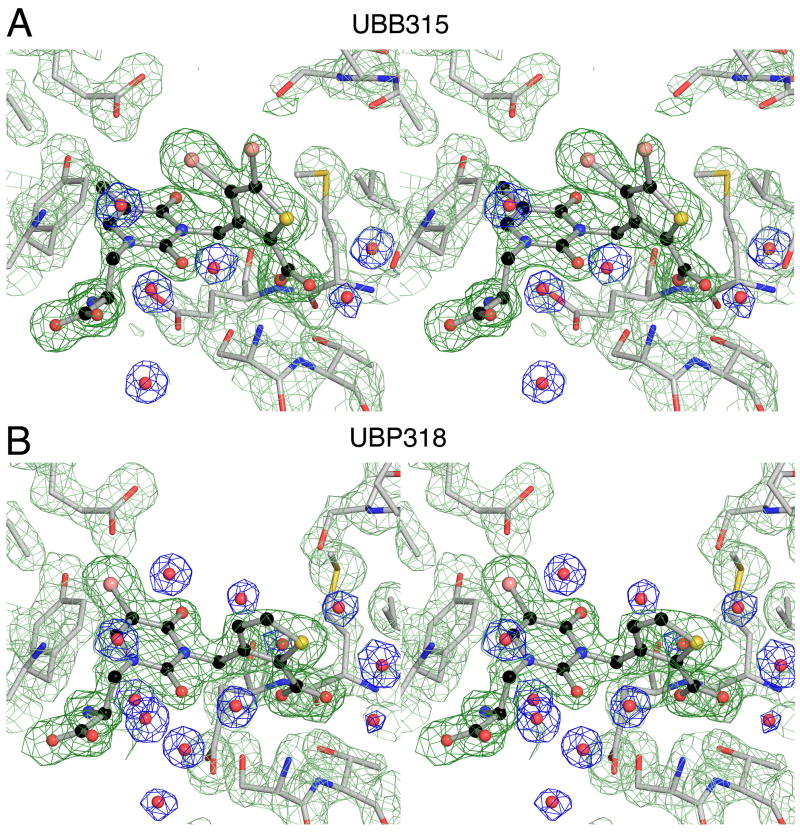
Figure 3.
Electron density maps for crystal structures of the GluK1 UBP315 and UBP318 complexes. (A) Stereoview at 1.8 Å resolution shows an Fo-Fc omit map contoured at 3.5 sigma (dark green) for which UBP315 atoms were omitted from the Fc calculation, and 2mFo-DFc maps for side chains (pale green) and water molecules (blue). (B) Stereoview of electron density maps at 1.8 Å resolution for the UBP318 complex prepared as described above for UBP315,

