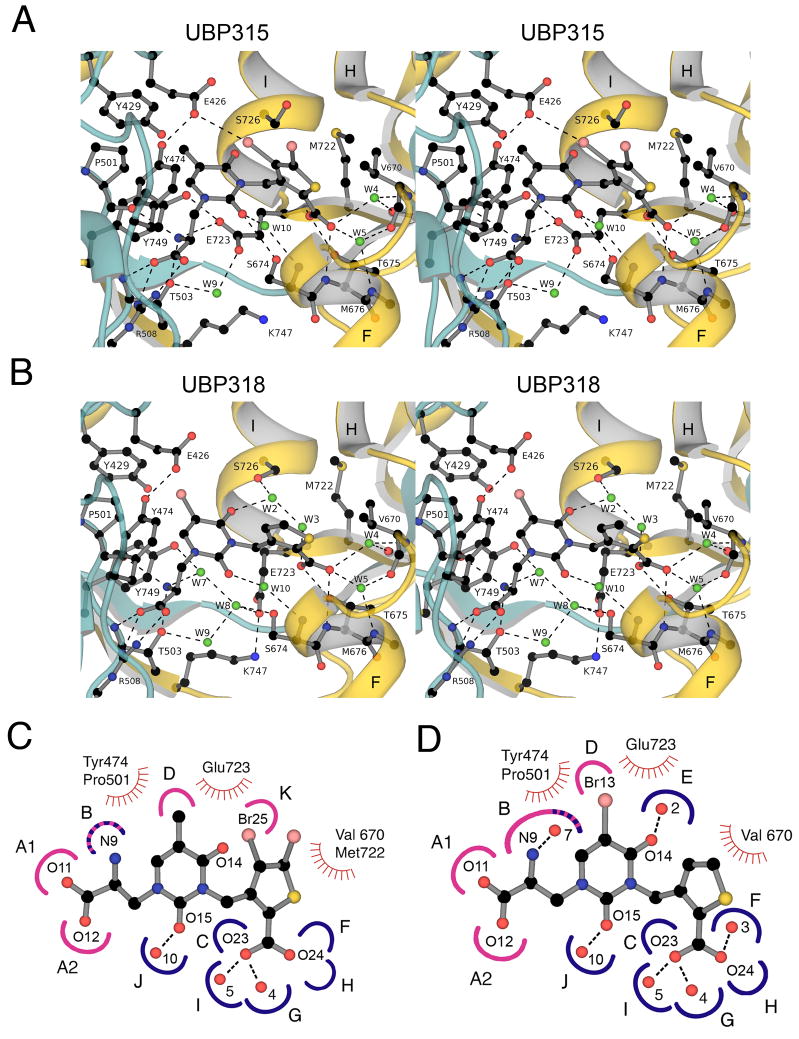
Figure 4.
Crystal structures and subsite maps for the GluK1 UBP 315 and UBP318 complexes. (A) Stereoview of the GluK1 UBP315 complex; the ribbon diagram showing secondary structure elements for domains 1 and 2 is colored cyan and gold, respectively; waters are shown as green spheres; hydrogen-bonds and ion pair interactions are represented as dashed lines. The side chain of Glu426 forms a halogen bond with Br25 of the ligand. (B) Stereoview of the GluK1 UBP318 complex colored as above; note the different conformation of the Glu723 and S726 side chains, rearrangement of solvent networks, and the change in orientation of the thiophene ring compared to the UBP315 complex. (C) Subsite map showing schematic representations of UBP315 with the GluK1 binding pocket; hydrogen bond and ion pair sites generated by domains 1 and 2 are colored pink and blue respectively; stripes indicate sites generated by both domains; sites of van der Waals contacts are indicated by hatched curved red lines. To make this figure, torsion angles in the UBP315 ligand were adjusted compared to the conformation found in the crystal structure to bring the heterocyclic rings into approximately the same plane for ease of illustration. (D) Subsite map showing schematic representations of UBP318 with the GluK1 binding pocket.

