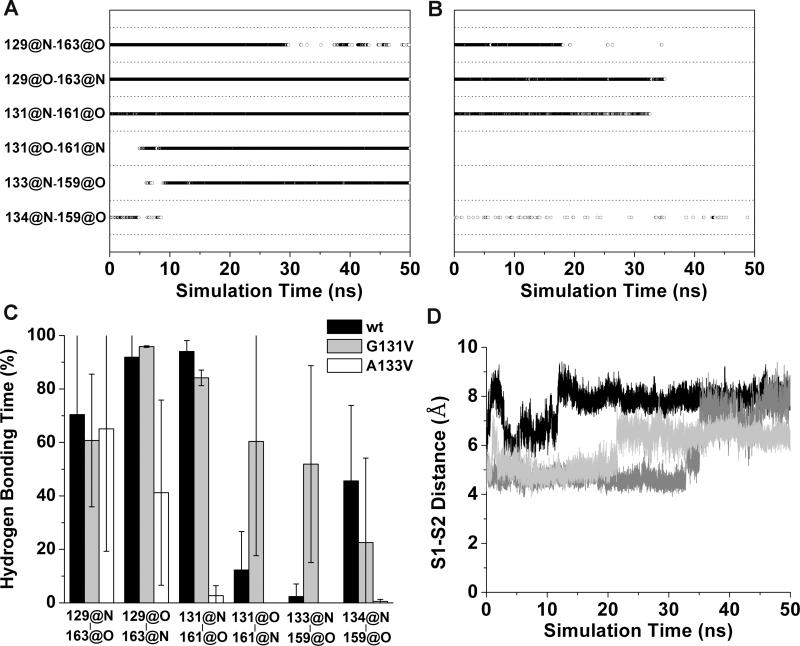
Figure 4.
Changes in the native sheet upon G131V and A133V mutations. Main-chain hydrogen bonds of the native sheet are plotted vs. simulation time for (A) run 1 of PrP mutant G131V and (B) run 2 of PrP mutant A133V. A symbol represents that the hydrogen bond indicated by a y label exists at the time indicated by a x value. C. Percentage of hydrogen bonding times in the period of 25-50 ns averaged over all runs. x labels indicate the hydrogen bonds. Error bars show the standard deviation. D. The distances between the centers of masses of the backbone atoms of the S1 and S2 strands during MD simulations of PrP mutant A133V. The results of run 1 (black), run 2 (dark gray), and run 3 (light gray) are shown.

