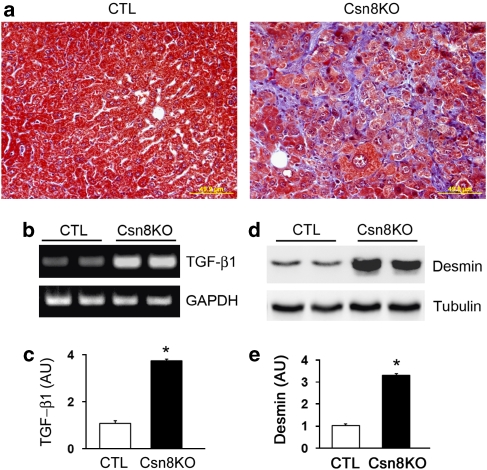
Figure 11.
HR-Csn8KO mice develop liver fibrosis. (a) Representative Masson's trichrome staining micrographs showing extensive pericellular and perisinusoid matrix deposition in the HR-Csn8KO liver at 6 months. Scale bar =50 μm. (b, c) RT-PCR analysis of TGF-β1 expression in mouse livers. Representative PCR images (b) and a bar graph summarizing data from four independent repeats (c) are presented. (d, e) Western blot analyses of desmin protein in mouse livers. Representative images (d) and a bar graph summarizing densitometry data from four independent repeats (e) are presented. *P<0.01 versus CTL

