Abstract
The purpose of the study was to investigate the effect of drug solubility on polymer hydration and drug dissolution from modified release matrix tablets of polyethylene oxide (PEO). Different PEO matrix tablets were prepared using acetaminophen (ACE) and ibuprofen (IBU) as study compounds and Polyox® WSR301 (PEO) as primary hydrophilic matrix polymer. Tablet dissolution was tested using the USP Apparatus II, and the hydration of PEO polymer during dissolution was recorded using a texture analyzer. Drug dissolution from the preparations was dependent upon drug solubility, hydrogel formation and polymer proportion in the preparation. Delayed drug release was attributed to the formation of hydrogel layer on the surface of the tablet and the penetration of water into matrix core through drug dissolution and diffusion. A multiple linear regression model could be used to describe the relationship among drug dissolution, polymer ratio, hydrogel formation and drug solubility; the mathematical correlation was also proven to be valid and adaptable to a series of study compounds. The developed methodology would be beneficial to formulation scientists in dosage form design and optimization.
Key words: drug dissolution, modified release, polymer hydration, texture analyzer
INTRODUCTION
Water-soluble polymer polyethylene oxide (PEO) has been extensively used as a controlled release excipient to modify drug release and dissolution from solid hydrophilic matrix preparations. This is mainly attributed to the desirable hydration and modified release properties by PEO of variable grades and molecular weights (1–4). Once in contact with a liquid, PEO will start to hydrate and swell, forming a hydrogel layer that regulates further penetration of the liquid into the matrix and the diffusion of the drug molecules from the dosage form (5). As a result of hydrogel formation, the rate of water intake slows down while that of drug release declines and prolongs. The formation of a hydrogel layer on the surface of a modified release matrix tablet is generally categorized into three stages, i.e., initial hydrogel increase due to polymer swelling; maintenance of constant gel layer thickness between swelling and dissolution front; reduction in gel layer thickness due to depletion of the glassy core (6,7). It has been hypothesized that drug release at zero-order mechanism can be achieved as long as a constant thickness of the hydrogel layer is maintained (8,9).
Numerous factors from tablet ingredients and preparation can influence drug release from a swellable matrix tablet, which may include drug solubility and drug loading (10–12), polymer molecular weight and ratio (4,13,14), tablet processing procedure (15), compression force (14,16), and tablet physical configuration (17). Among these parameters drug solubility plays a very important role in modifying the rate and extent of drug release. For highly water-soluble drug candidates, dissolution from a hydrophilic polymeric matrix is primarily controlled by the diffusion of the drug molecules through the hydrogel layer; a high drug concentration gradient within the gel layer facilitates drug delivery. For drug candidates with lower aqueous solubility, however, drug release rate is mainly dependent upon the erosion of the polymeric matrix (11). As the result, the swelling characteristics of the hydrophilic polymer may significantly influence drug release profiles. In addition, hydration and erosion of the polymer matrix lead to further water intake and penetration; this will subsequently impact drug diffusion and dissolution.
Mathematical models have been established to describe the relationship between polymer hydration and drug dissolution from hydrophilic matrix tablets and to simulate the effect of device geometry on drug release patterns. Siepmann et al. used the power of “sequential layer” model to describe drug release from HPMC matrix tablets (18,19). Colombo et al. also derived equations to depict the correlation between drug release rate and hydrogel layer thickness (6). While these models are theoretically applicable to a variety of polymers and drug candidates, sophisticated instrumentation and advanced mathematical skills are also required to determine polymer hydration and perform data analysis. Li and Gu recently reported a simplified mathematical correlation that described the relationship between drug dissolution, hydrogel thickness and PEO ratio in a modified release matrix tablet of pseudoephedrine (PSE) (20). The measurement of PEO hydration was collected using a texture analyzer with simplified and straightforward study protocol; the three-dimensional linear regression satisfactorily correlated the three preparation parameters that are not only directly measurable but also closely associated with formulation design and optimization.
To make any mathematical modeling valid and useful, it is necessary to verify the existing relationship with different substitutes. It was hence hypothesized that PEO matrix tablet preparations made of other drug candidates would demonstrate similar polymer hydration characteristics and their dissolution profiles could be described using the same mathematical process. In this study, twelve modified release matrix tablets were designed and prepared using two drug substances that possessed lower aqueous solubility than PSE. Using similar experimental methodology, drug dissolution and polymer hydration were measured and analyzed. The objective of the study was to confirm the validity and applicability of the mathematical correlation that had been previously established (20). In addition, the experimental protocol was further refined to make it adaptable to modified release matrix tablets of any hydrophilic polymers other than PEO.
MATERIALS AND METHODS
Materials
Two study drug substances, acetaminophen USP (ACE) and ibuprofen (IBU), were purchased from Medisca Pharmaceutique Inc. (Montreal, QC, Canada) and Sigma Chemical Co. (St. Louis, MO, USA), respectively. Tablet excipients, Polyox® WSR301 (PEO, polyethelene oxide, Union Carbride Corporation, Danbury, CT, USA), Compritol® 888ATO (GB, glyceryl behenate NF, Gattefossé s.a., Lyon, France), and Prosolv® HD90 (MC, silicified microcrystalline cellulose, The Dow Chemical Company, Midland, MI, USA), were received as gifts from the companies. PVP K30 USP (polyvinylpyrrolidone) was purchased from Spectrum Chemical Manufacturing Corp. (Gardena, CA, USA).
Chemical reagents and solvents used in the HPLC analysis of the two drug compounds were all purchased from Fisher Scientific (Fair Lawn, NJ, USA), which included concentrated acetic acid, concentrated phosphoric acid, acetonitrile and methanol. All chemicals and reagents used were either HPLC grade or AC grade. Deionized water was obtained from a Millipore® Milli-Q System (Bedford, MA, USA) in the laboratory.
Solubility Measurement
To measure the aqueous solubility of the two study drugs, a supersaturated solution was prepared for each individual compound using deionized water; the suspension was stirred continuously at 25 °C overnight. After filtration to remove extra insoluble drug particles, the saturated solution was further diluted to an appropriate concentration and analyzed using an established HPLC assay. Drug solubility was calculated based on the individual calibration of the model drugs. Drug solubility was measured in six replicates.
Tableting
Twelve test formulations were designed and prepared according to Table I, identical to what had been studied using PSE (20). The active ingredient was kept identical at 40% of the total tablet weight in all formulas, while PEO varied between 10% and 50% of the total tablet weight. Several other tablet excipients were also incorporated to achieve a consistent tablet weight of 300 mg, but the ingredients contributed little to polymer hydration and modified drug release.
Table I.
Compositions of Test Formulations
| Ingredients (mg) | F1 | F2 | F3 | F4 | F5 | F6 |
|---|---|---|---|---|---|---|
| Study druga | 120 | 120 | 120 | 120 | 120 | 120 |
| PEO | 30 | 45 | 60 | 75 | 90 | 150 |
| GB | 9 | 9 | 9 | 9 | 9 | 9 |
| PVP | 15 | 15 | 15 | 15 | 15 | 15 |
| MC | 126 | 111 | 96 | 81 | 66 | 6 |
| Tablet weight | 300 | 300 | 300 | 300 | 300 | 300 |
| PEO percentage (%) | 10 | 15 | 20 | 25 | 30 | 50 |
aACE or IBU
The matrix tablets were prepared by direct compression of the powder mixtures using a Manesty® single-punch tablet press (Liverpool, UK). A set of 7/16 punches and die was used for the tableting, and the compression force was maintained at 50 kg/cm2 for all 12 tablet formulations. The hardness of the prepared tablets was monitored during and after tableting using an Erweka® tablet hardness tester (Düsseldorf, Germany).
Drug Dissolution
Drug dissolution of the prepared matrix tablets was performed using a USP Apparatus II method at 37 ± 0.5 °C (VanKel® 600 Dissolution Apparatus, Palo Alto, CA, USA); 900 ml deionized water was used as the dissolution medium and the peddle speed was set at 50 rpm. Dissolution samples were collected at 0.5, 1, 1.5, 2, 4, 6, 8 and 12 h respectively; each sample volume removed was replenished with an equal volume of fresh pre-heated dissolution medium. Six replicates were tested for each batch of the tablet formulations.
Concentrations of ACE and IBU in the collected dissolution samples were analyzed using official USP chromatographic assays with a Waters® system (21). Prior to analysis, the samples were filtered and diluted to an appropriate concentration within the established calibration curves. The detection limit was 10 ng for both ACE and IBU; the linear calibration range of the assays ranged 50–1,000 ng. No interference was found from other tablet excipients or additives.
Polymer Swelling Testing
Measurement of polymeric hydration and swelling behaviors from the prepared matrix tablets was carried out using a TA Texture Analyzer (Texture Technologies Corp., Scardale, NY, USA) as previously reported (20,22). In brief, the instrument was equipped with a flat-end, round cylindrical stainless steel probe (∅2 × L30 mm) to measure the distance with which the probe traveled within the hydrogel formed from polymer hydration. The initial speed of the probe was set at 2.0 mm/s until a force of 0.7 g was sensed on the surface of the tablet, at which point the speed of the penetrating probe was reduced to 0.2 mm/s. Once the probe detected a force of 500 g upon the un-swollen matrix core, the probe withdrew automatically out of the hydrogel layer at a speed of 0.2 mm/s. All testing data were collected and processed by Texture Expert software.
To prepare samples for texture analysis, each matrix tablet was snapped into a cylindrical polyethylene cap that had an internal diameter equivalent to that of the tablets. Samples prepared in this matter would allow for water penetration and polymer hydration only in one direction, subsequently facilitating standardization of the texture analysis. The tablet samples were placed in 900 ml of deionized water, and subjected to the same dissolution testing conditions as previously described. Six replicates were tested for polymer hydration at each time interval.
Data Analysis
Data analysis was carried out as previously described (20). In particular, the empirical Peppas–Ritger dissolution equation was used to characterize drug release mechanisms from the prepared matrix tablet formulations; the time required for 50% of the drug dose to be released (DT50%) was also obtained and compared among the preparations (23,24). To correlate results between drug dissolution and texture analysis, linear regression was employed to describe the three-dimensional relationship among drug release fraction, polymer content in the preparation and parameters of texture analysis (hydrogel thickness and the area under the curve). In addition, the influence of drug solubility on dissolution and polymer hydration was also examined; mathematical equations from the data analysis were obtained and compared.
RESULTS AND DISCUSSION
Drug solubility is one of the primary parameters that dictate drug release rate and dissolution from solid dosage forms such as tablets and capsules. As a result, solubility also influences in vivo performance of the preparation, specifically bioavailability and therapeutic efficacy, since an active ingredient must be in the form of a solution before being systemically absorbed and distributed. Many solid controlled release delivery systems rely on aqueous solubility of the active ingredients to achieve modified drug release profiles. For this study, two drug substances with variable solubility characteristics were used to demonstrate the effects of solubility on polymer hydration and drug dissolution. The aqueous solubility of ACE and IBU was found to be 18.9 ± 0.3 mg/ml (mean±SEM, n = 6) and 134.0 ± 0.4 mg/ml, respectively. In addition, solubility of PSE was measured at 565.3 ± 0.3 mg/ml previously (20). There was a range of approximately 30-folds in aqueous solubility between ACE (least soluble) and PSE (most soluble). It was anticipated that this solubility range would produce significant differences in formulation characterization and be reliably representative of a wide range of drug compounds in use.
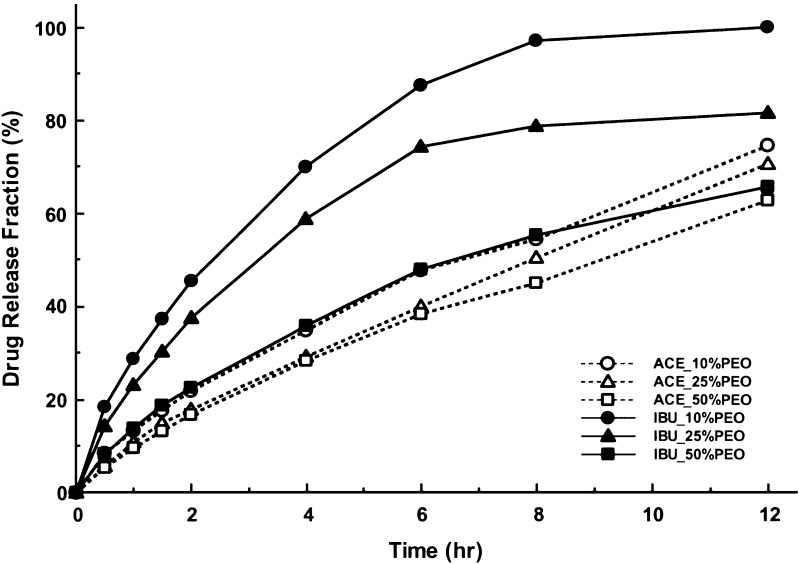
Not only does drug solubility dictate the rate and extent of drug release from the tablets, but it influences polymer hydration and swelling of hydrophilic PEO matrix as well. PEO polymer gradually hydrates and swells once in contact with the dissolution medium. While physical properties play a primary role in hydration and swelling of PEO, drug solubility does facilitate the process of hydration by allowing continuous water penetration through diffusion and dissolution. Figure 1 shows the representative dissolution curves from the two study drug compounds. As estimated, drug dissolution was reduced with the decrease in aqueous solubility of the active ingredients. Both ACE and IBU were able to sustain drug release between 10 and 12 h; this was in contrast to the previous study in which PSE completed drug dissolution within 6 h due to a higher aqueous solubility (20). In addition, modification of the drug release was influenced by the PEO proportion present in the tablet preparations. Increase in PEO proportion retarded the uptake of water by the matrix core, consequently prolonged the drug diffusion and dissolution from the preparations.
Fig. 1.
Representative dissolution plots of modified release matrix tablets of ACE and IBU
Dissolution parameters are good indicators of drug release characterization, and commonly used as an essential determinant in formulation design and optimization. There are numerous empirical equations depicting the rate and extent of drug release from a modified release tablet or capsule. Table II lists dissolution parameters obtained from Peppas–Ritger dissolution equation and the dissolution half-life (DT50%). The effects of drug solubility on drug release modification were evident among the three study formulations. Release rate constant and dissolution half-life were reversely correlative of the solubility properties, and significantly different among the three compounds. Nevertheless, no distinction was observed regarding drug release mechanism among all tablet preparations; the diffusional exponents (n) were all within the range of 0.45–0.89, indicating a non-Fickian drug release mechanism for all matrix formulas. In addition, good linearity (r2 > 0.99) was obtained between logarithm drug release and dissolution time, which indicated a first-order drug release mechanism for all test preparations. This further confirmed that drug dissolution was mainly controlled by the diffusion of drug molecules from the tablet matrix, and that erosion of hydrophilic polymer during the dissolution occurred at a much slower rate than drug diffusion.
Table II.
In Vitro Drug Release and Dissolution Parameters
| Formulation | Diffusional Exponent (n) | Release Rate Constant (k) | Correlation Coefficient (r 2) | DT50% (h) |
|---|---|---|---|---|
| ACE | 0.698–0.856 | 0.097–0.134 | >0.997 | 6.6–8.5 |
| IBU | 0.623–0.706 | 0.137–0.282 | >0.999 | 2.5–6.4 |
| PSEa | 0.471–0.563 | 0.398–0.509 | >0.996 | 0.9–1.7 |
aFrom previous study of pseudoephedrine (20)
The presence of hydrophilic polymer PEO in a matrix tablet would result in dynamic formation and change of a hydrogel layer on the surface of the tablet upon in contact with water. Solid drug–polymer matrix core will transform from its initial dry (glassy) stage to a wet (rubbery) stage while dissolution medium is permeating through the tablet surface. This is another critical parameter in addition to drug solubility that would modify drug release characteristics. Drug release rate and extent are inversely proportional to the thickness of this hydrogel layer, because it takes time for drug molecules to travel across the gel layer and reach the dissolution medium (6,25). In addition, higher proportion of polymer in the tablet enables the formation of a thicker hydrogel layer and subsequently slower erosion of the gel shell, further retarding drug release from the preparations.
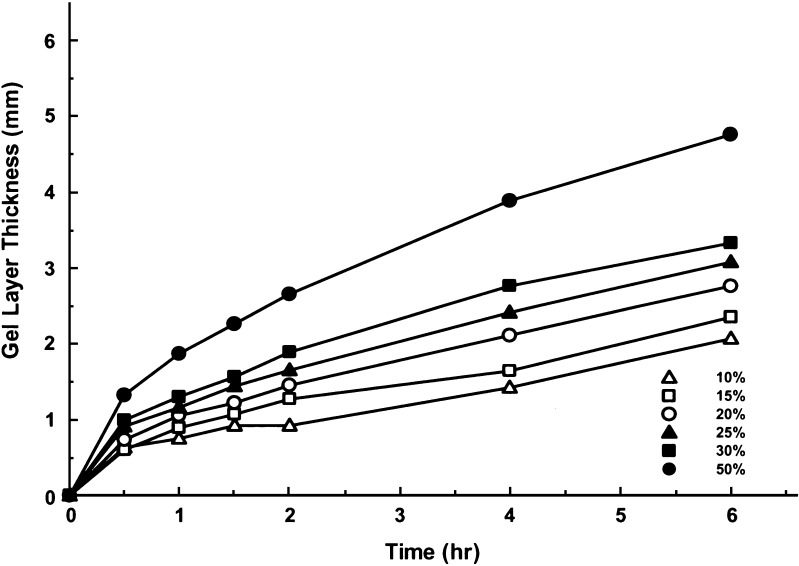
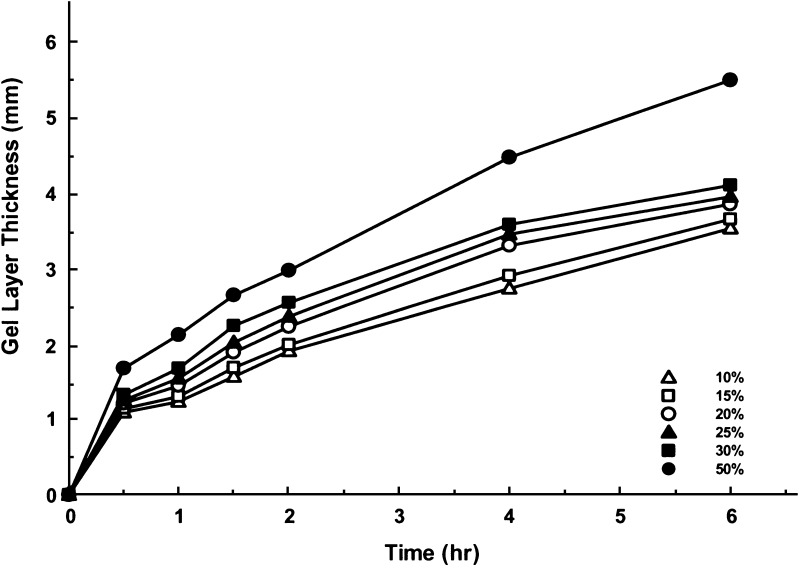
Dependent on the type and amount of the polymers used in the tablet core, transition from the glassy state to the rubbery state might be variable. The interval that is required of the transition is also correlated to the aqueous solubility of the active ingredients, since polymer hydration will take place only after penetrating water has dissolved the solid drug substance. In previous study of PSE, the phase transition was achieved within 30 min of the drug dissolution, as the compound has a very high aqueous solubility. The hydrogel layer thickness was not significantly influenced by the amount of PEO present in the study formulations (20). However, the formation of hydrogel swelling was dependent on the solubility of ACE and IBU in this study. In particular, the thickness of hydrogel measured at 30 min demonstrated differences among the six formulas for both compounds (Figs. 2 and 3); this was mainly attributed to the ability of water penetrating into the tablet core and drug diffusion out of the preparations. While the gel layer thickness in both ACE and IBU tablets at 6 h was approximately 50% of the value of the PSE tablets, the two formulas that contained 50% of PEO produced identical hydrogel layer, suggesting that PEO contributed more to hydrogel swelling at higher proportions.
Fig. 2.
Hydrogel layer thickness–time plots of ACE
Fig. 3.
Hydrogel layer thickness–time plots of IBU
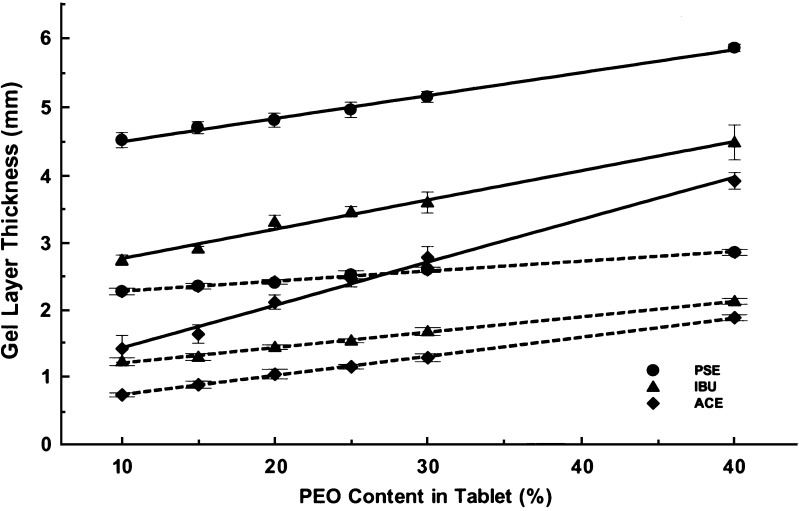
Linear correlation was observed between gel layer thickness and PEO content in the study preparations for both ACE and IBU; similar characteristics were also found with PSE tablets, but the gel layer formed was much thicker than that of ACE and IBU. Figure 4 shows representative linear plots for the three compounds at 1 and 4 h. This linear relationship between the polymer content and the gel layer thickness could act as an indicator for formulators in designing and optimizing new matrix tablets of PEO. It is relatively easy and straightforward to measure gel layer thickness using instrument such as a texture analyzer. By collecting data of hydrogel layer thickness, it is possible to create a linear relationship that subsequently will lead to characterization of hydrogel formation and drug dissolution at different content of PEO.
Fig. 4.
Linear correlation plots between gel layer thickness and PEO content at 1 h (solid lines) and 4 h (dashed lines) for ACE, IBU and PSE tablets (r 2 ≥ 0.99) (PSE data from reference 20)
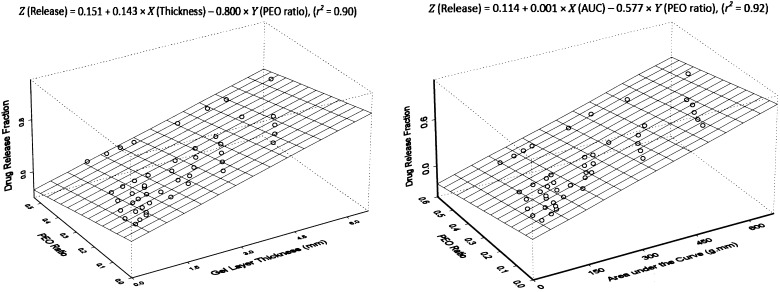
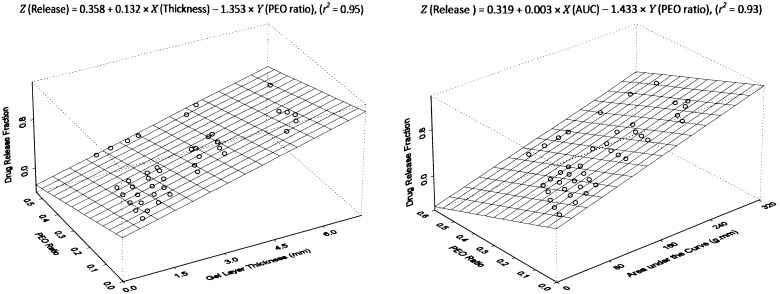
A linear relationship among tablet formulation, drug dissolution and texture analysis has been previously established by using a multiple regression model with PSE matrix tablets (20). The equation directly relates changes of drug dissolution to gel layer hydration and polymer content in the preparations. This mathematical modeling provides a practical and simplified approach for tablet modification and optimization, because all three variables are directly measurable. To further confirm the validity of the modeling, same methodology was used here to process the data obtained from this study. Linear relationship was again observed among the three parameters for both ACE and IBU, indicating the applicability of the mathematical calculation for all matrix tablets made of PEO polymers. Figures 5 and 6 show the multiple regression plots of the calculation in a three-dimensional configuration for ACE and IBU, respectively. This configuration describes a plane of linear fitting for drug release property as the function of both texture analysis parameters and polymer content in the preparation. Differences with the content of hydrophilic polymer in tablets would lead to changes in hydration of the tablet core, which would subsequently contribute to modifications in drug release and dissolution.
Fig. 5.
Multiple regression plots of ACE dissolution, PEO content and texture analysis parameters
Fig. 6.
Multiple regression plots of IBU dissolution, PEO content and texture analysis parameters
For formulators working in dosage form development and assessment, the ultimate goal of using a mathematical modeling is to collect minimal study samples yet to achieve predictable theoretical estimation of the drug release characteristics. This would expedite the process of designing dosage forms and reduce the resources required of the early development stages. To explore the possibility of devising an all-inclusive equation that can be used to reliably predict drug release in associated with critical study parameters, further attempt was made to incorporate the variables of drug solubility and dissolution time into the linear regression described above. It was found that satisfactory linearity still exists among these various parameters. The mathematical equations describing the relationship were  and
and  , respectively. These equations established a direct correlation among the variables of tablet characteristics, which would enable the estimation of drug release based on drug solubility, PEO ratio, dissolution time and gel layer thickness. This kind of correlation demonstrates highly practical application benefits to formulation development and optimization with the modified release matrix preparations of PEO polymers.
Both drug solubility and polymer hydration play important roles in drug dissolution of a modified release matrix tablet. These two parameters are closely related to each other and equally contribute to drug release modifications. High drug solubility is able to facilitate faster water penetration into the polymer matrix and diffusion of soluble drug molecules across the hydrogel layer. On the other hand, polymer hydration enables the swelling of the hydrophilic PEO, subsequently leading to more water penetration and drug dissolution. Using three study compounds that possess a wide range of aqueous solubility, satisfactory linearity has been obtained to correlate numerous tablet parameters. This mathematical equation should be further expanded to test matrix formulations of other hydrophilic polymers, so that its applicability in expediting development routines could be realized with efficiency and accuracy.
There are numerous methods available for the determination of polymer hydration and swelling from modified release matrix tablets; these methodologies employ variable criteria and collect different parameters. Texture analysis is an inexpensive and straightforward instrumentation that has demonstrated unique applications in pharmaceutical development and assessment. In comparison to other sophisticated instruments used in polymer characterization, this method is considered more adaptable and acceptable to formulation optimization due to its operation simplicity and versatility. It would provide additional and beneficial tools to formulators in designing and optimizing novel modified release tablet preparations.
CONCLUSION
Dissolution of ACE and IBU from modified release PEO matrix tablets was dependent upon drug solubility, hydrogel formation and polymer proportion in the preparation. Delayed drug release was mainly attributed to the rate and extent of hydrogel formation on the surface of the tablet and of water penetration into the core matrix. The multiple linear regression model previously established was still valid and adaptable to describe the relationship among drug dissolution, polymer ratio, hydrogel formation and drug solubility for ACE and IBU. Texture analysis is a simplified and versatile methodology added to pharmaceutical research that would be beneficial to dosage form development by reducing bench experiments and expediting throughput outcomes.
Acknowledgements
The authors acknowledge the research support from Canadian Foundation for Innovation (CFI), graduate studentship (HL) from University of Manitoba and summer research studentship (RH) from the Merck Research Foundation. The generous supply of tablet excipients from Dow Chemical Company, Gattefossé s.a., and Union Carbride Corporation is also acknowledged.
References
- 1.Apicella A., Cappello B., Del Nobile M. A., La Rotonda M. I., Mensitieri G., Nicolais L. Poly(ethylene oxide) (PEO) and different molecular weight PEO blends monolithic devices for drug release. Biomaterials. 1993;14:83–90. doi: 10.1016/0142-9612(93)90215-N. [DOI] [PubMed] [Google Scholar]
- 2.Zhang F., McGinity J. W. Properties of sustained-release tablets prepared by hot-melt extrusion. Pharm. Dev. Technol. 1999;4:241–250. doi: 10.1081/PDT-100101358. [DOI] [PubMed] [Google Scholar]
- 3.Razaghi A. M., Schwartz J. B. Investigation of cyclobenzaprine hydrochloride release from oral osmotic delivery systems containing a water-swellable polymer. Drug Dev. Ind. Pharm. 2002;28:631–639. doi: 10.1081/DDC-120003854. [DOI] [PubMed] [Google Scholar]
- 4.Choi S. U., Lee J., Choi Y. W. Development of a directly compressible poly(ethylene oxide) matrix for the sustained-release of dihydrocodeine bitartrate. Drug Dev. Ind. Pharm. 2003;29:1045–1052. doi: 10.1081/DDC-120025863. [DOI] [PubMed] [Google Scholar]
- 5.Colombo P., Bettini R., Santi P., Peppas N. A. Swellable matrices for controlled drug delivery: gel-layer behaviour, mechanisms and optimal performance. Pharm. Sci. Technol. Today. 2000;3:198–204. doi: 10.1016/S1461-5347(00)00269-8. [DOI] [PubMed] [Google Scholar]
- 6.Colombo P., Bettini R., Massimo G., Catellani P. L., Santi P., Peppas N. A. Drug diffusion front movement is important in drug release control from swellable matrix tablets. J. Pharm. Sci. 1995;84:993–997. doi: 10.1002/jps.2600840816. [DOI] [PubMed] [Google Scholar]
- 7.Bussemer T., Peppas N. A., Bodmeier R. Evaluation of the swelling, hydration and rupturing properties of the swelling layer of a rupturable pulsatile drug delivery system. Eur. J. Pharm. Biopharm. 2006;56:261–270. doi: 10.1016/S0939-6411(03)00070-5. [DOI] [PubMed] [Google Scholar]
- 8.Lee P. I., Peppas N. A. Prediction of polymer dissolution in swellable controlled-release systems. J. Control. Release. 1987;6:207–215. doi: 10.1016/0168-3659(87)90077-0. [DOI] [Google Scholar]
- 9.Narasimhan B., Peppas N. A. Molecular analysis of drug delivery systems controlled by dissolution of the polymer carrier. J. Pharm. Sci. 1997;86:297–304. doi: 10.1021/js960372z. [DOI] [PubMed] [Google Scholar]
- 10.Colombo P., Bettini R., Santi P., De Ascentiis A., Peppas N. A. Analysis of the swelling and release mechanisms from drug delivery system with emphasis on drug solubility and water transport. J. Control. Release. 1996;39:231–237. doi: 10.1016/0168-3659(95)00158-1. [DOI] [Google Scholar]
- 11.Kim C. J. Effects of drug solubility, drug loading, and polymer molecular weight on drug release from Polyoxâ tablets. Drug Dev. Ind. Pharm. 1998;24:645–651. doi: 10.3109/03639049809082366. [DOI] [PubMed] [Google Scholar]
- 12.Bettini R., Catellani P. L., Santi P., Massimo G., Peppas N. A., Colombo P. Translocation of drug particles in HPMC matrix gel layer: effect of drug solubility and influence on release rate. J. Control. Release. 2001;70:383–391. doi: 10.1016/S0168-3659(00)00366-7. [DOI] [PubMed] [Google Scholar]
- 13.Mitchell K., Ford J. L., Armstrong D. J., Elliot P., Rostron C., Hogan J. E. The Influence of concentration on the release of drugs from gels and matrices containing Methocel. Int. J. Pharm. 1993;100:155–163. doi: 10.1016/0378-5173(93)90086-U. [DOI] [Google Scholar]
- 14.Velasco M. V., Ford J. L., Rowe P., Rajabi-Siahboomi A. R. Influence of drug: hydroxypropylmethylcellulose ratio, drug and polymer particle size and compression force on the release of diclofenac sodium from HPMC tablets. J. Control. Release. 1999;57:75–85. doi: 10.1016/S0168-3659(98)00110-2. [DOI] [PubMed] [Google Scholar]
- 15.Alderman D. A. A review of cellulose ethers in hydrophilic matrices for oral controlled release dosage forms. Int. J. Pharm. Technol. Prod. Manuf. 1984;5:1–9. [Google Scholar]
- 16.Hirschorn J. O., Kornblum S. S. Dissolution of poorly water-soluble drugs II: excipient dilution and force of compression effects on tablets of a quinazolinone compound. J. Pharm. Sci. 1971;60:445–448. doi: 10.1002/jps.2600600321. [DOI] [PubMed] [Google Scholar]
- 17.Ford J. L., Rubenstein M. H., McCaul F., Hogan J. E., Edger P. J. Importance of drug type, tablet shape and added diluents on drug release kinetics from hydroxypropylmethylcellulose matrix tablets. Int. J. Pharm. 1987;40:223–234. doi: 10.1016/0378-5173(87)90172-4. [DOI] [Google Scholar]
- 18.Siepmann J., Podual K., Sriwongjanya M., Peppas N. A., Bodmeier R. A new model describing the swelling and drug release kinetics from hydroxypropyl methylcellulose tablets. J. Pharm. Sci. 1998;88:65–72. doi: 10.1021/js9802291. [DOI] [PubMed] [Google Scholar]
- 19.Siepmann J., Peppas N. A. Hydrophilic matrices for controlled drug delivery: an improved mathematical model to predict the resulting drug release kinetics (the “sequential layer” model. Pharm. Res. 2000;17:1290–1298. doi: 10.1023/A:1026455822595. [DOI] [PubMed] [Google Scholar]
- 20.Li H., Gu X. Correlation between drug dissolution and polymer hydration: a study using texture analysis. Int. J. Pharm. 2007;342:18–25. doi: 10.1016/j.ijpharm.2007.04.024. [DOI] [PubMed] [Google Scholar]
- 21.U. S. Pharmacopeia and National Formulary. United States Pharmacopeial Convention. Rockville, MD, 2000, pp. 18, 254.
- 22.Yang L., Johnson B., Fassihi R. Determination of continuous changes in the gel layer of poly(ethylene oxide) and HPMC tablets undergoing hydration: a texture analysis study. Pharm. Res. 1998;15:1902–1906. doi: 10.1023/A:1011970409699. [DOI] [PubMed] [Google Scholar]
- 23.Ritger P. L., Peppas N. A. A simple equation for description of solute release I. Fickian and non-Ficlian release from non-swellable devices in the form of slabs, spheres, cylinders or disc. J. Control. Release. 1987;5:23–36. doi: 10.1016/0168-3659(87)90034-4. [DOI] [PubMed] [Google Scholar]
- 24.Ritger P. L., Peppas N. A. A simple equation for description of solute release II. Fickian and anomalous release from swellable devices. J. Control. Release. 1987;5:37–42. doi: 10.1016/0168-3659(87)90035-6. [DOI] [PubMed] [Google Scholar]
- 25.Williams R. O., III, Reynolds T. D., Cabelka T. D., Sykora M. A., Mahaguna V. Investigation of excipient type and level on drug release from controlled release tablets containing HPMC. Pharm. Dev. Technol. 2002;2:181–193. doi: 10.1081/PDT-120003486. [DOI] [PubMed] [Google Scholar]


