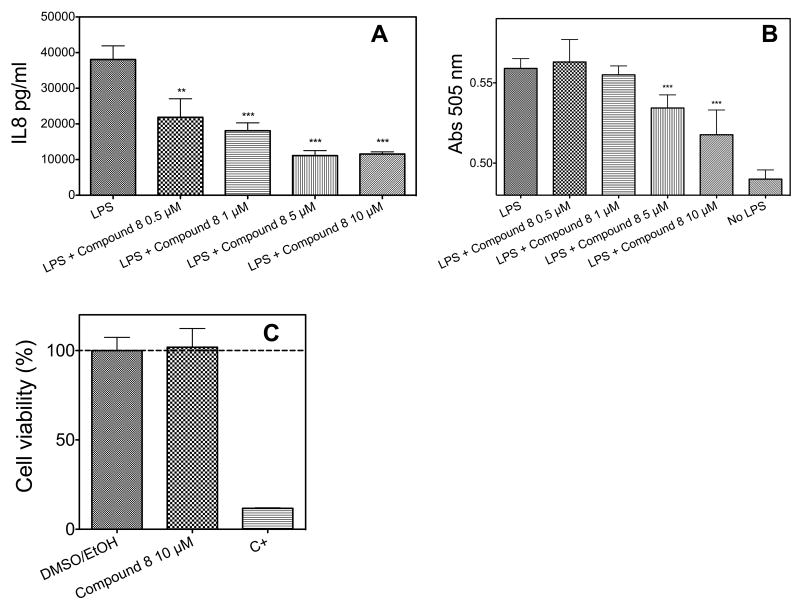
Figure 2.
(A) Co-administration of LPS and increasing amount of molecule 8 (0-10 μM) to 293/hTLR4A-MD2-CD14 cells. Cell activation was measured as extracellular production of IL-8 through an ELISA assay. (B) Measurement of activated NF-κB level in HEK-Blue™ cells when increasing amount of molecule 8 (0-10 μM) and supplemented with LPS as stimulus. (C) MTT assay of parental HEK cells (that do not express TLR4) in the presence of 10 μM molecule 8, of 0.5 % DMSO/EtOH and of a positive control.
Results shown represent the mean SEM of three independent experiments, each in triplicate. The asterisks indicate a significant statistical difference (P<0.01; ANOVA, Dunnett’s test) between data in the analyzed group and reference data (LPS alone for panel A and DMSO/EtOH for panel C).

