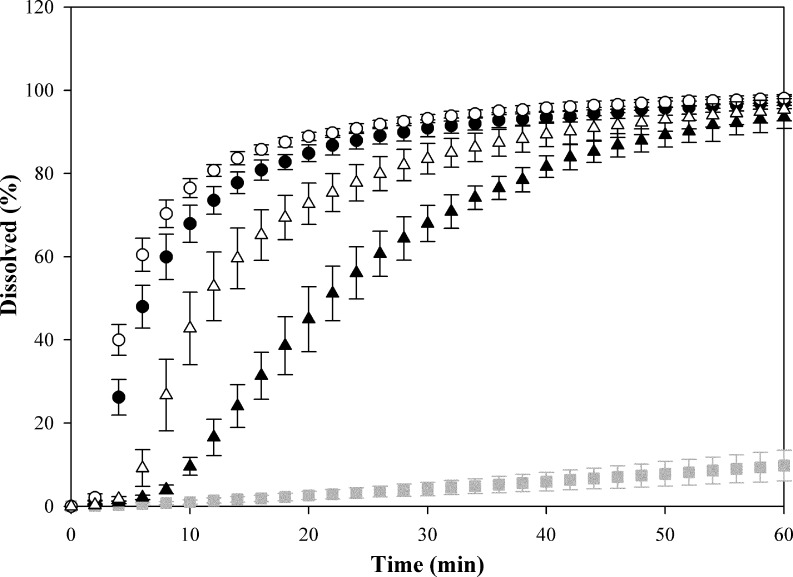
Fig. 4.
Dissolution profiles of tablets composed of a physical mixture ( ) and controlled crystallized dispersions of 35% w/w fenofibrate in mannitol. Controlled crystallized dispersions were prepared by slow freezing (closed symbols) or fast freezing (open symbols) and a low (−25°C) crystallization temperature (circles) or a high (−15°C) crystallization temperature (triangles). Process 1 corresponds to (●), process 2 corresponds to (▲), process 3 corresponds to (○), and process 4 corresponds to (△) (n = 3–6; mean ± standard deviation)

