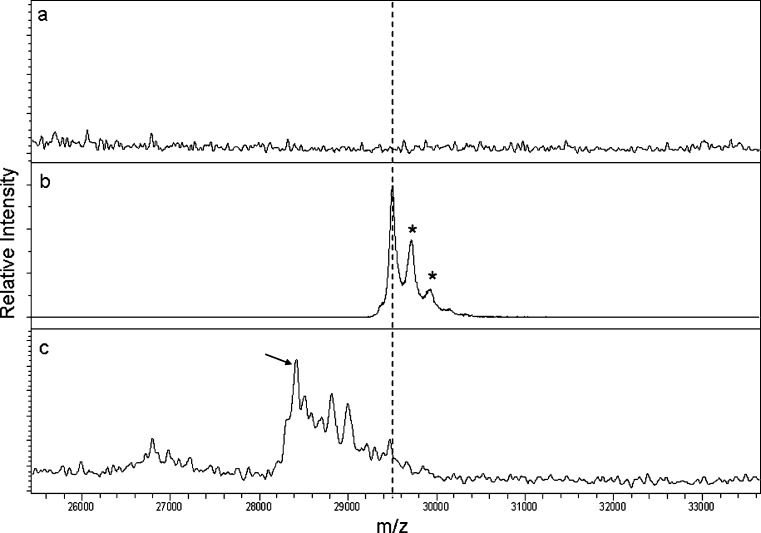
Fig. 2.
MALDI-TOF MS analysis of AMG531 and its metabolites in samples from rats dosed i.v. at 10 mg/kg: a pre-dose (negative control), b AMG531 spiked into control plasma at 10 μg/mL (positive control), and c 24 h post-dose. The peak corresponding to intact AMG531 is indicated by the hashed line. The peaks marked with asterisk represent SA adducts. The arrow in c indicates the major metabolite of AMG531 corresponding to proteolysis between T260 and L261

