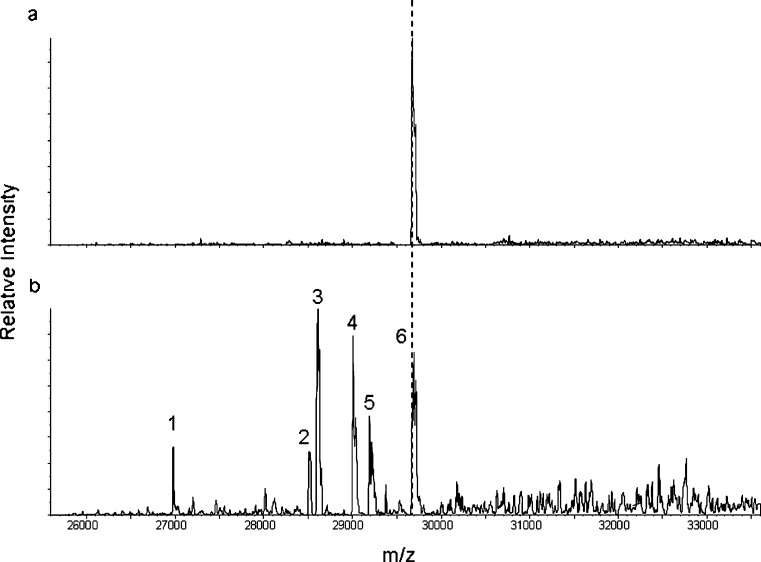
Fig. 3.
NanoLC-MS analysis of AMG531 and its metabolites in samples from rats dosed i.v. at 10 mg/kg: a 30 min and b 24 h post-dose. The 30-min spectrum shows only one peak corresponding to intact AMG531 (hashed line, peak 6). The peak numeric designation in b corresponds to peaks listed in Table I on identification of proteolytic points

