Figure 3.
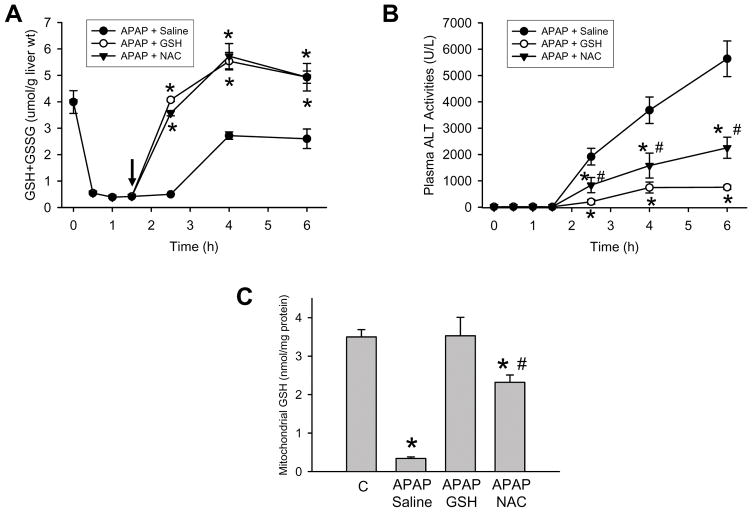
Time course of hepatic glutathione (GSH+GSSG) levels (A) and plasma ALT activities (B) after treatment with 300 mg/kg APAP. Some animals received additionally 10 ml/kg saline, 0.65 mmol/kg GSH or 0.65 mmol/kg N-acetylcysteine (NAC) iv 1.5 h after APAP. Data represent means ± SE of n = 4 animals per time point. *P<0.05 (compared to APAP/saline); #P<0.05 (compared to APAP/GSH)
C. Mitochondrial glutathione content in controls or 2.5 h after injection of APAP alone or in combination with GSH and NAC. Data represent means ± SE of n = 4 animals per group or time point. *P<0.05 (compared to controls, C); #P<0.05 (compared to APAP/GSH)

