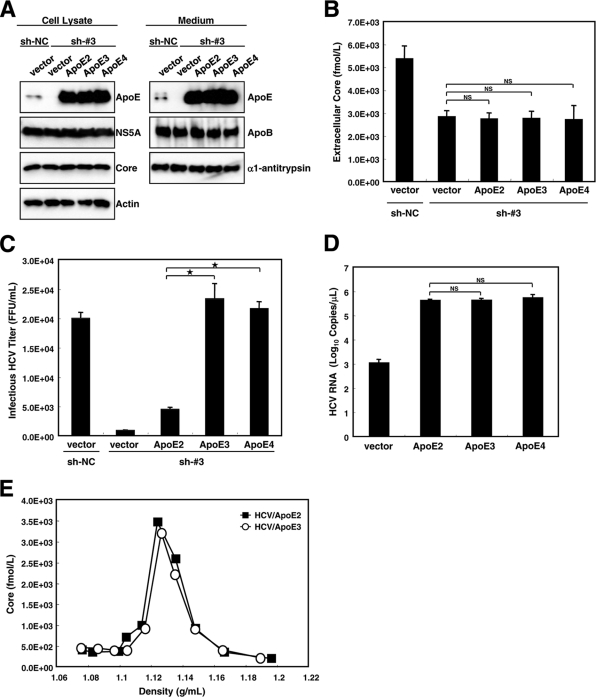
FIG. 3.
ApoE isoforms affect HCV infectivity. (A) Verification of expression of ectopically introduced ApoE and the effect of ApoE isoforms on HCV genome replication. sh-NC cells and sh-#3 cells were seeded onto 60-mm-diameter dishes. Cells were transfected with either pCAG (vector), pCAG-ApoE2 (ApoE2), pCAG-ApoE3 (ApoE3), or pCAG-ApoE4 (ApoE4). Four hours after transfection, cells were inoculated with JFH1. Forty-eight hours after inoculation, the expression of ApoE, ApoB, NS5A, core, actin, and α1-antitrypsin in cell lysates and/or supernatants was analyzed by Western blotting using relevant antibodies. (B) The release of HCV core into the culture supernatant by cells expressing different ApoE isoforms was measured by a core-specific ELISA. The cells and transfections in panels B to D were the same as those in panel A. P values were determined by comparison (by Student's t test) with HCVcc from sh-#3 cells expressing the control vector. NS, not significant (P > 0.05). (C) Amount of infectious HCV that egressed from HCV-infected cells. Culture media of the indicated cells were inoculated into naïve HuH7.5 cells. Forty-eight hours after infection, naïve HuH7.5 cells were infected with the supernatant. Forty-eight hours after infection, the titers of infectious HCV were quantified by a focus-forming unit assay. P values were determined by comparison (by Student's t test) with HCVcc from sh-#3 cells expressing ApoE2. *, P < 0.0005. (D) Association of HCV with ApoE isoforms. HCV released into the culture medium from cells bearing each ApoE isoform was incubated with an anti-HA antibody. RNA was extracted from the immunoprecipitant and subjected to quantification by quantitative RT-PCR. P values were determined by comparison (by Student's t test) with HCVcc from sh-#3 cells expressing ApoE2. NS, not significant (P > 0.05). (E) Density gradient analysis of HCVcc containing ApoE2 or ApoE3. Concentrated HCVcc from cells expressing ApoE2 or ApoE3 was fractionated using 14 to 54% iodixanol density gradient centrifugation at 36,000 rpm for 16 h at 4°C. The buoyant density profile is represented by measuring the amount of core protein (in femtomoles per liter). HCV/ApoE3, HCV bearing ApoE3; HCV/ApoE2, HCV bearing ApoE2. Data from a representative of three experiments are shown.

