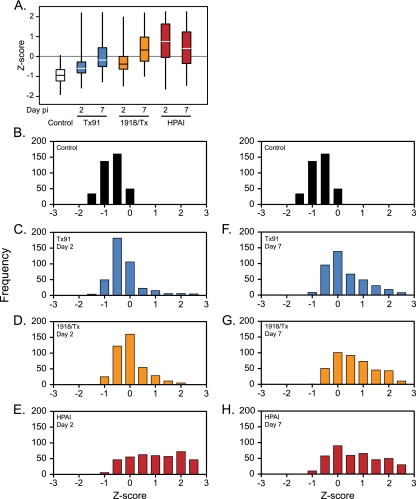
FIG. 2.
Distinct patterns of increased protein abundance in different viral infections. (A) Box plots indicate the interquartile ranges of Z-scores of spectral counts and whiskers designate the minimum and maximum values for the 400 proteins that increased during viral infection. (B to H) Relative levels of abundance for the 400 proteins were binned, based on Z-score of the spectral count, and are depicted in frequency histograms. Protein abundance was quantified for day 2 p.i. (B to E) and day 7 p.i. (F to H) in the control, Tx91, 1918/Tx, and HPAI groups, respectively.

