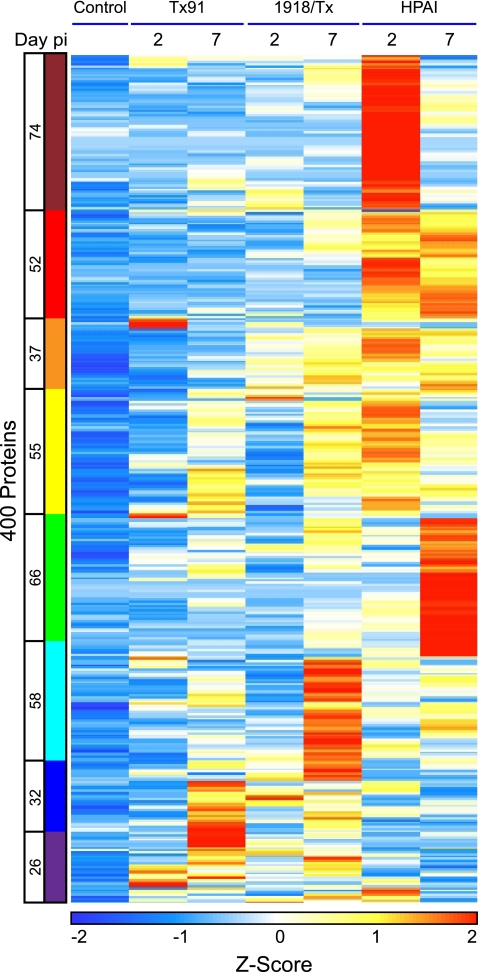
FIG. 3.
Heat map of Z-scores of spectral counts for the 400 increased proteins, organized into eight clusters by using the K-means algorithm. The eight clusters are color coded relative to the condition(s) in which proteins were most highly expressed. The number of proteins within a cluster is located to the left of the cluster bar.

